File:Global temperature change 1850-2016.gif
Global_temperature_change_1850-2016.gif (512 × 288 pixels, file size: 1.38 MB, MIME type: image/gif, looped, 168 frames, 45 s)
Note: Due to technical limitations, thumbnails of high resolution GIF images such as this one will not be animated.
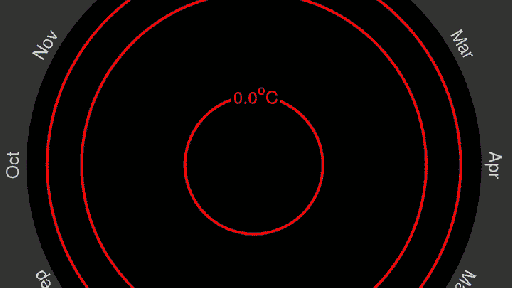
Global temperature spiral (1850-2020)
Visit the Global Temperature GIF animation, updated thru 2020:
Visit Ed Hawkins @ed_hawkins | https://twitter.com/ed_hawkins
To avoid reaching global temperature levels such as 1.5°C there is a limited amount of carbon dioxide we can emit into the atmosphere.
We are rapidly using up our 'Carbon budget' "...
More on Climate Change... Responsibility... Graphically
Via CarbonBrief

Which Countries Are Responsible for Climate Change?
- https://www.carbonbrief.org/analysis-which-countries-are-historically-responsible-for-climate-change
Watch the CarbonBrief History of CO2 Emissions (Video)
Since 1850, humans have collectively pumped more than 2,500Gt of CO2 into the atmosphere.
2/3 from burning fossil fuels ... 1/3 from land-use change & forestry'.
That's directly linked to the 1.2C of warming to date.
○
File history
Click on a date/time to view the file as it appeared at that time.
| Date/Time | Thumbnail | Dimensions | User | Comment | |
|---|---|---|---|---|---|
| current | 15:30, 1 October 2021 | | 512 × 288 (1.38 MB) | Siterunner (talk | contribs) |
You cannot overwrite this file.
File usage
The following 2 pages use this file:
- Air Quality
- Air Pollution
- Agriculture
- Alternative Agriculture
- Antarctica
- Anthropocene
- Arctic
- Atmospheric Science
- Citizen Science
- City Governments
- Climate Change
- Climate Migration
- Climate Policy
- County Governments
- Desertification
- Digital Citizen
- Earth Imaging
- Earth Observations
- Earth360
- Earth Science
- Earth Science from Space
- Earth System Science
- Ecology Studies
- Eco-nomics
- Economic Justice
- Education
- Energy
- Environmental Laws
- Environmental Protection
- Environmental Security
- Environmental Security, National Security
- ESA
- European Union
- Externalities
- Extinction
- Florida
- Food
- Forests
- Fossil Fuels
- Greenland
- Global Security
- Global Warming
- Green Graphics
- Green Networking
- Green Best Practices
- Green Politics
- Health
- INDC
- Maps
- Money in Politics
- NASA
- NOAA
- Natural Resources
- Networking
- New Definitions of National Security
- New Economy
- New Space
- Oceans
- Ocean Science
- Online Education
- Planet Citizen
- Planet Citizens
- Planet Citizens, Planet Scientists
- Rainforest
- Renewable Energy
- Resilience
- Sea-level Rise
- Sea-Level Rise & Mitigation
- Scotland
- Seventh Generation Sustainability
- Social Justice
- Soil
- Solar Energy
- Strategic Demands
- Sustainability Policies
- Threat Multiplier
- United Nations
- US Environmental Protection Agency
- Water Quality
- Whole Earth
- Wind Energy
- World Bank
- World Wide Web
- Youth