Virtual Earth
Mapping, Measuring, Monitoring and Managing
2023
Explore Open Geospatial Consortium
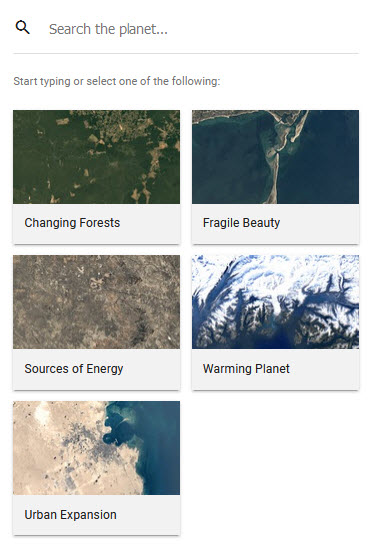
Explore Immersive 3D Experiences with Google Earth
New Ways AI Is Making Maps More Immersive
🌎

2022
Going Green, Going NetZero
Moving Day by Day, Year by Year toward Clean Energy
Climate Problems, Climate Solutions

🌎
Strategic Demands, Environmental Security
🌎

Project Drawdown, #ClimateCrisis Solutions
- Drawing down CO2 greenhouse gas emissions is smart green policy
- Our generation of 'planet citizens' must act now to make a positive difference
• http://www.drawdown.org/solutions/
• http://www.drawdown.org/solutions-summary-by-rank
• https://www.greenpolicy360.net/w/ProjectDrawdownCO2

······························································································
Map a Plan with Objectives and Intended Key Results
![]()

··································································································
To Get to Net Zero, Cities Are Making Tracking Maps
Ithaca, New York, has committed to fully decarbonizing by 2030. To achieve that goal, the city is creating a “digital twin” that can model energy use, building by building
Via CityLab / June 2022
In 2019, lawmakers in Ithaca, New York, resolved to eliminate or offset all carbon emissions by 2030, becoming the first city in the US to set such an ambitious global-warming benchmark.
Then it launched a $100 million plan to fund a massive municipal climate-proofing effort...
When the Ithaca Green New Deal plan was launched, two architecture professors at nearby Cornell University, Felix Heisel and Timur Dogan, realized they had a tool that could help — a map created using machine learning that estimates the costs of retrofitting, and future electricity grid loads, on a building-by-building level across the city.
Dogan, who runs Cornell’s Environmental Systems Lab, had for years been developing software that allowed architects to quantify the energy consumption and carbon footprint of buildings. Heisel, who leads the Circular Construction Lab, was working to understand what carbon neutrality really means when you account for material stock and embodied carbon. The pair of academics reached out to the city and offered their technology as a way to translate Ithaca’s bold goal into action. The map will be crucial as Ithaca determines its electrification priorities and funding allocations; if successful, the technology could be expanded to help all types of cities tackle building decarbonization at scale.
“Which buildings [do you] renovate first? Which buildings consume the most energy? Which ones would be the lowest hanging fruit to renovate?” said Dogan, describing the questions he hoped his software could answer.
Existing tech can do this fairly easily — but only one building at a time. That misses a big opportunity, Dogan says. “When you’re working at these scales, there are potentially synergies. Like, if you group buildings in a certain way, or if building owners team up to share investment costs of something like geothermal boreholes.”
That’s where Dogan and Heisel’s new energy modeling map — a “digital twin” of the city — comes into play.
Digital 'Twinning' in Orlando, Florida
How Cities Are Using Digital Twins Like a SimCity for Policymakers
The technology could help officials cut operating costs and carbon emissions of new construction, and avoid costly modifications after a project is completed. Amid an ever-looming climate crisis facing urban areas, it could enable cities to test the effectiveness of various measures against rising sea levels and urban heat. By one estimate, digital twins could save cities some $280 billion by 2030.
🌎
2021: Google Earth Can Track, Map & Monitor Climate Change
GreenPolicy360: For over 5 decades, beginning with visionary earth science from space missions in 1960s and 70s, the possibilities for tracking, measuring and monitoring earth's systems have exponentially improved. Today, as we enter the 2020s, many new and critically essential earth imaging, earth observation, and atmospheric science tools, combined with decades of data, baselines and trendlines, dynamic changes, are now usable by scientists in ways the visionaries (such as George Brown) hoped would be gathered and become scientific reality. Applications (APIs in current nomenclature) have, at a crucial moment in history, become available for the nations of the world. We, at GreenPolicy360, continue our decades of work on this green, environmental and political front. Our hope is soon to launch a new project, an open-source, easily accessible database of climate-related green best practices, a go-to hub of nationally determined plans, pledges and promises being advanced to deal with climate change. We believe, as stated since our start up, that sharing green best practices, i.e., turning ripples into waves in a physics of peace and positive change, is an effective strategy in our common era when positive change is demanded. #ClimateCrisis #GreenPolicy360 #StrategicDemands
Earth Science Research from Space
Look at how thin our atmosphere is
Planet Citizens, Planet Scientists
Intended Nationally Determined Contributions

🌎
- Journey into a Timelapse
- (Bioneer) Rebecca Moore, Director, Google Earth, Earth Engine & Outreach:
- To explore Timelapse in Google Earth, go to g.co/Timelapse — choose any place on the planet where you want to see time in motion.
·······················································································
Carbon Mapping
- Using Earth Imaging to Map, Track & Mitigate CO2 Emissions


Measure it, Map it. Manage it. Breathe easier.'
With 92% of the global population living in areas that the World Health Organization (WHO) deems as exceeding safe air pollution levels, there is a pressing need to better understand air pollution.
As the former mayor of New York City Michael Bloomberg once said about air pollution: “If you can't measure it, you can't manage it and you can't fix it.” Recent innovation in low-cost pollution sensors has enabled a new generation of air quality monitoring that provides actionable high-resolution data at a fraction of the cost of traditional monitoring systems. We’re now able to see clearer than ever, real-time snapshots of where air pollution is coming from and traveling to, and who is most affected.
Air Quality / Air Pollution

AirNow / International Air Quality
World Air Quality Index / World's Air Pollution: Real-time Air Quality Index
Particulate air pollution is the single greatest threat to human health globally.

Earth Mapping Developments & Updates
One of GreenPolicy360's favorite "planet citizens", Rebecca Moore of Google Earth / Earth Outreach
“The story of your family history, the story of your favorite hiking trip – it could be anything. It doesn’t have to be profound,” Google Earth Director Rebecca Moore.
Google Earth is opening up this functionality... teaming up with primatologist Jane Goodall to tell stories of the Yanomami peopleCinta Larga and the Boa Vista Quilombola. Utilizing maps for story-telling is just the beginning of the story, of how we can begin to see our world/planet, and the journeys and changes we make, over time. Our new virtual tools are just beginning to come into view...
- GreenPolicy Siterunner: Going back a number of years to George E. Brown, a Congressman from East LA for decades and a mentor to GreenPolicy360's siterunner, we look at one of the projects that George Brown worked to pioneer (and save from termination during cutbacks of the Ronald Reagan presidency.) The economic/ecological/scientific benefits of LANDSAT, for over fifty years now in operation, are immense. Google Earth's move to establish "Timelapse" maps is another in a profound number of extensions and uses to which the earth science of LANDSAT is being employed to benefit environmental security.
Google Earth Engine / Time Lapse
Timelapse is a global, zoomable video that lets you see how the Earth has changed over the past 32 years. It is made from 33 cloud-free annual mosaics, one for each year from 1984 to 2016, which are made interactively explorable by Carnegie Mellon University CREATE Lab's Time Machine library, a technology for creating and viewing zoomable and pannable timelapses over space and time.
Using Earth Engine, Google Earth Timelapse combined over 5 million satellite images acquired over the past three decades by 5 different satellites. The majority of the images come from Landsat, a joint USGS/NASA Earth observation program that has observed the Earth since the 1970s. For 2015 and 2016, we combined Landsat 8 imagery with imagery from Sentinel-2A, part of the European Commission and European Space Agency's Copernicus Earth observation program.
Search, pan, or zoom around to begin exploring the new Earth Engine Timelapse, or check out Google Earth's YouTube highlights. To embed the timelapse viewer on your site, use the “Share or embed” button above. You can also create a Timelapse tour that moves from one destination to another over time using the Timelapse Tour Editor.
Timelapse is an example that illustrates the power of Earth Engine’s cloud-computing model, which enables users such as scientists, researchers, and journalists to detect changes, map trends, and quantify differences on the Earth's surface using Google’s computational infrastructure and the multi-petabyte Earth Engine data catalog.
Data sources
- NASA Landsat Program, Landsat 4 (1984-1993), Landsat 5 TM (1984-2012), Landsat 7 ETM+ (1999-2013), Landsat 8 OLI (2013-2016), courtesy of the U.S. Geological Survey, Sioux Falls.
- Copernicus Sentinel Program, Sentinel 2A MSI Level 1C, European Union/ESA/Copernicus, 2015-2016.
- MOD09GA MODIS/Terra Surface Reflectance Daily L2G. NASA EOSDIS Land Processes DAAC, 2000-2016.
- MCD43A4 MODIS Terra+Aqua Nadir BRDF-Adjusted Reflectance 16-Day L3. NASA EOSDIS Land Processes DAAC, 2000-2016.
- ETOPO1 1 Arc-Minute Global Relief Model. National Geophysical Data Center, NOAA.
- Land Water Mask Derived from MODIS and SRTM L3. Version 5. NASA EOSDIS Land Processes DAAC.
- Hansen Global Forest Change v1.2 (2000-2014).
··············································
Restoring Ecosystems
• Via the Bioneers / How Mapping Technology Can Help Us Tell Stories and Protect Ecosystems
Google Earth Outreach founder and visionary engineer Rebecca Moore says the signs are all around us, telling us that our life-support systems are in critical condition. Only recently has it become possible to monitor the health of Earth’s life-sustaining resources in a manner both globally consistent and locally relevant. Moore is showing how satellite data, cutting-edge science and powerful cloud computing technology such as Google Earth Engine allow us to achieve an unprecedented understanding of our changing environment and put this data into the hands of those who can take action. Combined with Google Earth’s new narrative storytelling tool, grassroots activists, communities and other environmental change-makers can now vividly show what’s at stake, and envision solutions in ways that can change hearts and minds, while guiding wiser decision-making to protect and restore our vast, fragile planet....
Rebecca, a long-time 'Bioneer', explains Google Earth mapping technology at the 2018 Bioneers Conference.
• https://bioneers.org/rebecca-moore-google-earth-and-using-big-data-to-map-solutions/
Rebecca Moore: We’re going to talk about Earth’s vital signs. Think about it: When you go to the doctor, you can get your heart function measured, your lungs, your brain. You can get all kinds of tests done. But what about the planet? What about the Amazon that produces the oxygen that we breathe, or all the river systems of the world that are like its bloodstream? Where can we all go and know how healthy those critical systems of our Earth are? Historically, the answer has been basically nowhere. But if there’s ever been a moment to harness technology in service of planetary health, this is it...
Watch Rebecca's full-video Bioneers presentation
········································································
Earth Sciences / EcoExploring / EcoMapping

How Facebook, Apple and Microsoft are contributing to an openly licensed map of the world
Collaborating in the open to build an openly licensed map of the world: OpenStreetMap
August 2018
OpenStreetMap, launched in 2004, has grown into one of the most successful collaboratively maintained open datasets in the world. Today, contributors to the maps include not just keen local mappers, but also a diverse mix of commercial organisations, non-governmental organisations, humanitarian organisations and also large commercial organisations.
The Microsoft Open Maps team has recently released open data on building footprints in the US. Microsoft was among the first to release satellite imagery for use by OpenStreetMap and the images are now integrated into the default editor. It also has a community of mappers directly contributing to OpenStreetMap in Australia.
Apple has an internal volunteer programme that has around 5,000 staff contributing to Missing Maps, they’ve released building data for France and Denmark, and are engaged with data improvement projects around the world.
Facebook is exploring how artificial intelligence-assisted tracing can help to improve the quality of OpenStreetMap data in Thailand.
DigitalGlobe has made its satellite imagery available under a licence that will allow it to be used by the OpenStreetMap community to improve their mapping efforts.
Telenav launched OpenStreetCam to help collect openly-licensed street imagery and has now released open data and code to explore how machine learning can enable the images to be used to improve OpenStreetMap with stop signs and turn directions.
More at StateoftheMap
·····································
Why Mapping, why GIS?
The many fields of earth and environmental science are open to new ways of seeing, discovering and applying solutions using the latest digital, information technology.
Across the globe and in each local community, new IT capabilities are employing terrestrial data collections techniques and 'eyes in the sky' to deliver data into mapping platform and applications. We are using software platforms and tools to analyze our world and planet's systems in ways never before available.
Across most every industry, our new digital skills touch how we live and how we sustain our environment and improve the quality of our lives.
- https://web.mst.edu/~rogersda/gis/History%20of%20GIS.pdf (Environmental / Slide Presentation)
- "The purpose of this Global Positioning Satellite (GPS) study was to assist the White House Office of Science and Technology Policy and the members of the National Science and Technology Council."
- (See the background on creation of the White House Office and Technology Council)

In Memory of Congressman George E. Brown from East Los Angeles for his vision and work to launch the Landsat program. Rep. Brown, as a leader on the US House Committee on Science, Space and Technology, was a key supporter of the Landsat program and its 'open' satellite imagery, science and data that sparked industries and new ways of seeing and applying science to real-world mapping and rising environmental, eco-nomic challenges.
Let's Look at Geographic Information Systems (GIS)
Consider the fields of:
- Agriculture
- Climate, Weather, and the Atmosphere
- Conservation and Resources
- Environmental Management
- Forestry
- Mining and Safety
- Oceans and Fisheries
- Sustainable Development
- Water Resources
and many more opportunities in almost every field.
The opportunities to change what has been 'business-as-usual' to 'business-with-vision' are multiplying. Traditional economics is becoming an eco-nomics in the process of our new knowledge base and new ways of monitoring and observing change over time.
Take a look at just one 'case study' of how you can 'change the world' by using these new earth mapping tools.
Let's us introduce a friend of ours, a Bioneer, Rebecca Moore.

GreenPolicy360 highlights Rebecca Moore
Rebecca envisioned setting up Google Outreach -- and she did.
Then Rebecca convinced Google to 'grow' her venture -- and they did...
Here are two history-making ventures that act to change economics of the past to an eco-nomics future.
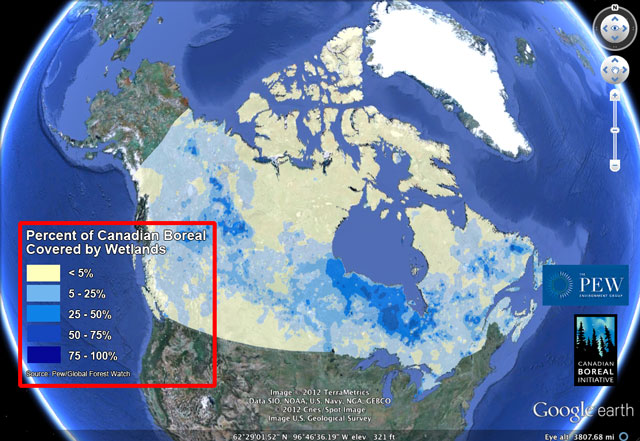
The Global Fishing Watch and Global Forest Watch, as envisioned and realized, act to enable us, as planet citizens and planet citizens, planet scientists to improve our world and work toward sustainable economies and resilient, sustainable life systems.
Google Outreach continues its impact

Share Your Data
Forest Watch & World Resources Institute
Monitoring the World's Forests
Start with where you are... just as Rebecca did, in her home community, her local forest grove...
Google Earth Outreach Is Out in Front
Out in Front: A Green Best Practice Concept and Google Earth is Again Reaching Out with New Best Practices
Air Quality Mapping: Environmental Monitoring for Health and Safety
○
The Environmental Defense Fund and Google Earth Outreach convened a mobile measurement team to assess air pollution at a level of detail that was nearly impossible before.
Seeing pollution mapped this way makes us better advocates for cleaner air and smart development choices.
--- Cassandra Ely, Project lead at EDF
○
○
Venture On with Best Green Ideas
- Going Green


- SJS / GreenPolicy360 Siterunner:
- Going green begins with a decision, a decision to go where you want to go, a step at a time at first, choosing to create waves, waves that ripple out to create more waves...
- Being green is to be a planet citizen.
○ ○ ○ ○ ○ ○ ○ ○ ○ ○ ○ ○ ○ ○ ○ ○ ○ ○

Where Am I?
AI Facebook Mapping, Citizen Mapping, United Nations Mapping
- Facebook’s artificial-intelligence software... capable of mapping more in a week than humanity has mapped in history
○
○

○ ○ ○ ○ ○ ○ ○ ○ ○ ○ ○ ○
- New Maps of Global Ecological Land Units
*https://ecoexplorer.arcgis.com/eco/maps.html
*https://www.aag.org/global_ecosystems
*https://www.aag.org/galleries/default-file/AAG_Global_Ecosyst_bklt300.pdf
*https://www.wired.com/2015/02/new-map-shows-worlds-ecosystems-unprecedented-detail/
The Global Ecological Land Unit maps are the most detailed look ever at Earth’s ecosystems. Basically, it partitions the planet into squares 50 meters on a side—roughly the size of a couple of football fields. An ecosystem looks at lithology (that’s rocks and dirt), climate, topography, and land cover—from pristine forest to pavement. Each square on the map combines those categories of data, and every pixel can be described in a single sentence—say, warm, wet hills on volcanic rocks with mostly evergreen forests. Underneath: reams of reference. A world’s worth of data.
The US Geological Survey pulled that information from a wide swath of sources—soil surveys, digital elevation models, satellites, weather stations. But the agency didn’t have the computing power to chew it into meaningful maps. So, they partnered with ESRI, the titanic digital mapping company, which marshaled an army of geographers, analysts, and cartographers to knit everything together. Ecologists have always relied on maps made by experts based on their on-the-ground research. They were good, but subjective. Data is better. “It’s a huge confidence boost to the scientists that we are on the right track to understanding things in a comparable way,” says Charlie Frye, ESRI’s chief cartographer. After sharing it with veteran ecologists, Frye says they responded by telling him that this map showed them what they already knew, but at scales they’d never seen before.
And what’s good for research is good for conservation...
○ ○ ○ ○ ○ ○ ○ ○ ○ ○ ○ ○
River Basins & Watersheds

Ecoregions
○ ○ ○ ○ ○ ○ ○ ○ ○ ○ ○ ○ ○ ○ ○ ○ ○ ○ ○ ○
- APPS
Smartphone Apps/Browser add-ons/extensions
○ ○ ○ ○ ○ ○ ○ ○ ○ ○

Google Maps from Space
International Space Station Viewing
https://www.google.com/streetview/#international-space-station/cupola-observational-module
https://www.greenpolicy360.net/w/File:Google_Maps_from_Space_July212017-800x500.png
○ ○ ○ ○ ○ ○ ○ ○ ○ ○
- Google Maps
Street Views, Voyaging on Google Earth & Earth View
and, of course, the mapping beginnings roll-out ...
Street View Art & Travel

○ ○ ○ ○ ○ ○ ○ ○ ○ ○ ○ ○

Google Earth Updates, a project with no end in sight
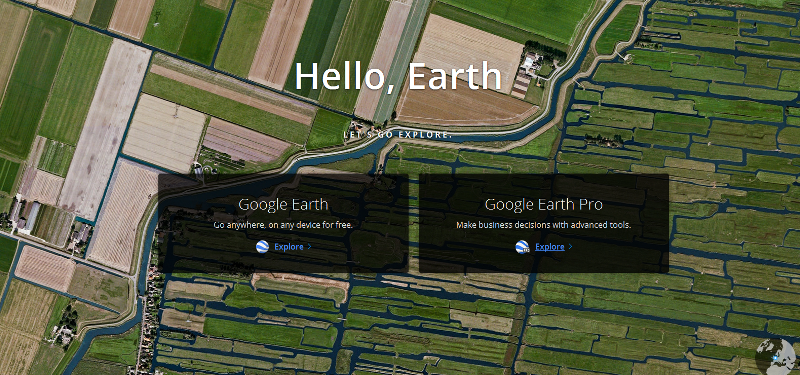
For the past two years, Google has been working on a new version of one of its most popular tools: Google Earth.
Ready for the new Google Earth "just in time for Earth Day"
Earth "Voyager" video - https://youtu.be/O-XidwKsKAE
The guided tours, which Google calls “Voyager,” aren’t just some hacked together algorithmic mess, they’re led by scientists and documentarians. At launch there are 50 tours available of places like Gombe National Park, a variety of North America’s National Parks, or a tour of Frank Gehry’s buildings. Google also teams up with BBC and Planet Earth, so you can zoom in on different locations from the show and learn more. (Thorin Klosowski)
Google Earth’s “I’m Feeling Lucky” button isn’t totally random. Instead Google has curated a database of 20,000 different places around the world that are worth exploring... a new feature is a 3D button that lets you view a place from any angle. And NASA is working with Google Earth. (Sarah Perez)
Google Earth VR
Google Earth VR - Virtual Reality
Google Earth‘s VR variant launches new feature that allows search for any place where you want to go, in addition to receiving support for Oculus and its Touch Controllers.
The new search function, when activated, prompts a VR keyboard that you can manipulate with your respective headset’s controllers. Once you’ve found a destination, you’ll be able to warp there instantly. With Google Earth VR now having full Oculus support, the same version that’s on Steam for HTC Vive users will now work with the Oculus Rift headset, and the app is also available in the Oculus store.
In 2016 Google launches a VR version of its Google Earth software for the HTC Vive ...


○
Google Earth Pro is now available to download free/February 2015 - https://google-latlong.blogspot.com/2015/01/google-earth-pro-is-now-free.html
Google Earth http://www.google.com/earth/
- Google Earth Outreach
https://www.google.com/earth/outreach/tutorials/mapper_temp.html
https://www.google.com/earth/outreach/tutorials/spreadsheet.html
https://www.google.com/earth/outreach/tutorials/spreadsheet3.html
https://www.google.com/earth/outreach/tutorials/mapseng_lite.html
○ ○ ○ ○ ○ ○ ○ ○ ○ ○ ○ ○
- Microsoft Bing / Virtual Earth
Bing Maps Platform (previously Microsoft Virtual Earth) - https://www.microsoft.com/maps/
§
- Mapquest (US) - https://www.mapquest.com/
§
- NASA Maps
Web-enabled LandSat Data https://weld.cr.usgs.gov/
NASA World Wind https://worldwind.arc.nasa.gov/java/ -- http://worldwind.arc.nasa.gov/java/
"World Wind lets you zoom from satellite altitude into any place on Earth. Leveraging Landsat satellite imagery and Radar Topography data, World Wind lets you experience Earth terrain in visually rich 3D..."
NASA Earth Observatory Global Maps https://earthobservatory.nasa.gov/GlobalMaps/?eocn=topnav&eoci=globalmaps
○ ○ ○ ○ ○ ○ ○ ○ ○ ○ ○ ○ ○ ○ ○ ○ ○ ○
More Maps & Apps Online
![]()
- Bing Maps and Bing Maps 3D.
- Bhuvan is an India-specific virtual globe.
- CitySurf Globe, fast adaptation and transfer secured data due to special data storage structure, dynamic spatial data editing on 3D client monitor, data stored in Oracle SDO or PostGIS, flexible authorization models for different user groups (LDAP and Active Directory support) also excellent quality and fast 2D map rendering.
- Earth3D, a program that visualizes the Earth in a real-time 3D view. It uses data from NASA, USGS, the CIA and the city of Osnabrück. Earth3D is free software (GPL).
- EarthBrowser, an Adobe Flash/AIR-based virtual globe with real-time weather forecasts, earthquakes, volcanoes, and webcams.
- Google Earth, satellite & aerial photos/datasets (including commercial DigitalGlobe images) with international road dataset (first popular virtual globe along with NASA World Wind).
- MapJack covers areas in Canada, France, Latvia, Macau, Malaysia, Puerto Rico, Singapore, Sweden, Thailand, and the United States.
- Marble, part of the KDE, with data provided by OpenStreetMap, as well as NASA Blue Marble: Next Generation and others. Marble is Free and open-source software (LGPL).
- NASA World Wind, USGS topographic maps and several satellite and aerial image datasets, the first popular virtual globe along with Google Earth. World Wind is open-source software (NOSA).
- OpenWebGlobe, a virtual globe SDK written in JavaScript using WebGL. OpenWebGlobe is free and open-source software (MIT).
- QGIS, desktop GIS system.
List of geographic information systems software / Via Wikipedia
'Virtual Globe' software information / Via Wikipedia
Consider (from Wikipedia) how data can be collected for mapping, for GIS, for applications and platforms:
Example of hardware for mapping (GPS and laser rangefinder) and data collection (rugged computer). The current trend for geographical information system (GIS) is that accurate mapping and data analysis are completed while in the field. Depicted hardware (field-map technology) is used mainly for forest inventories, monitoring and mapping.
Data capture—entering information into the system—consumes much of the time of GIS practitioners. There are a variety of methods used to enter data into a GIS where it is stored in a digital format.
Existing data printed on paper or PET film maps can be digitized or scanned to produce digital data. A digitizer produces vector data as an operator traces points, lines, and polygon boundaries from a map. Scanning a map results in raster data that could be further processed to produce vector data.
Survey data can be directly entered into a GIS from digital data collection systems on survey instruments using a technique called coordinate geometry (COGO). Positions from a global navigation satellite system (GNSS) like Global Positioning System can also be collected and then imported into a GIS. A current trend in data collection gives users the ability to utilize field computers with the ability to edit live data using wireless connections or disconnected editing sessions. This has been enhanced by the availability of low-cost mapping-grade GPS units with decimeter accuracy in real time. This eliminates the need to post process, import, and update the data in the office after fieldwork has been collected. This includes the ability to incorporate positions collected using a laser rangefinder. New technologies also allow users to create maps as well as analysis directly in the field, making projects more efficient and mapping more accurate.
Remotely sensed data also plays an important role in data collection and consist of sensors attached to a platform. Sensors include cameras, digital scanners and lidar, while platforms usually consist of aircraft and satellites. In England in the mid 1990s, hybrid kite/balloons called Helikites first pioneered the use of compact airborne digital cameras as airborne Geo-Information Systems. Aircraft measurement software, accurate to 0.4 mm was used to link the photographs and measure the ground. Helikites are inexpensive and gather more accurate data than aircraft. Helikites can be used over roads, railways and towns where UAVs are banned.
Recently with the development of miniature UAVs, aerial data collection is becoming possible with them. For example, the Aeryon Scout was used to map a 50-acre area with a Ground sample distance of 1 inch (2.54 cm) in only 12 minutes.
The majority of digital data currently comes from photo interpretation of aerial photographs. Soft-copy workstations are used to digitize features directly from stereo pairs of digital photographs. These systems allow data to be captured in two and three dimensions, with elevations measured directly from a stereo pair using principles of photogrammetry. Analog aerial photos must be scanned before being entered into a soft-copy system, for high-quality digital cameras this step is skipped.
Satellite remote sensing provides another important source of spatial data. Here satellites use different sensor packages to passively measure the reflectance from parts of the electromagnetic spectrum or radio waves that were sent out from an active sensor such as radar. Remote sensing collects raster data that can be further processed using different bands to identify objects and classes of interest, such as land cover.
When data is captured, the user should consider if the data should be captured with either a relative accuracy or absolute accuracy, since this could not only influence how information will be interpreted but also the cost of data capture.
After entering data into a GIS, the data usually requires editing, to remove errors, or further processing. For vector data it must be made "topologically correct" before it can be used for some advanced analysis. For example, in a road network, lines must connect with nodes at an intersection. Errors such as undershoots and overshoots must also be removed. For scanned maps, blemishes on the source map may need to be removed from the resulting raster. For example, a fleck of dirt might connect two lines that should not be connected.
○


More Mapping References
Monitoring Earth and Delivering Data Sets from Space
Earth Science Research from Space


- September 27, 2021

Measuring & Monitoring Earth from Space


Join In ! Be a Planet Citizen, Planet Scientist
○ ○ ○ ○ ○ ○ ○ ○ ○ ○ ○ ○ ○ ○ ○ ○ ○
More Maps to Guide You
○
○
○
Most popular mapping apps in the US as of April 2018, by monthly users
- Google Maps (154 Million)
- Waze (25.6 M)
- Apple Maps (23.3 M)
- Mapquest (20.9 M)
- Google Earth (5.2 M)
- Yahoo! Maps (2.8 M)

More Maps with Perspective
Change the Way You Look at Our World

- Authagraph - “The AuthaGraph World Map provides an advanced precise perspective of our planet.”
https://www.authagraph.com/data/wp-content/uploads/2010/03/AG_top.gif
- TheTrueSize.com - Not a "Mercator Projection"
- How Do You See Africa? -- https://www.weforum.org/agenda/2015/12/this-map-will-change-how-you-see-africa
- How Do You See the World? -- https://www.weforum.org/agenda/2016/02/the-map-that-will-change-how-you-see-the-world/
○
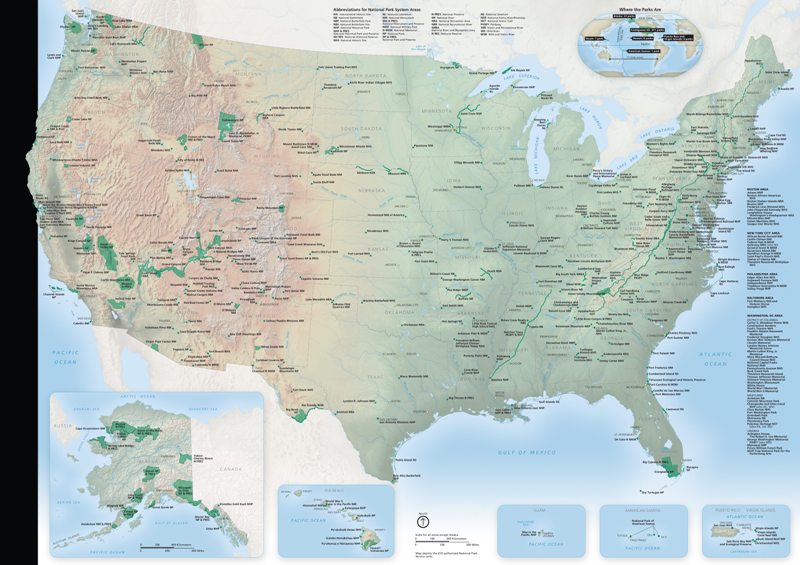
US National Parks Maps: A Personal Project.
Begun in 2013 by Colorado park ranger Matt Holly, the site currently (as of 2017) hosts “1,198 free high-resolution national park maps to view, save, and download.”
○
Carto
○ ○ ○ ○ ○ ○ ○ ○ ○ ○ ○ ○ ○ ○ ○ ○ ○ ○ ○ ○
- Earth Biosphere Mapping
○ ○ ○ ○ ○ ○ ○ ○ ○ ○ ○ ○ ○ ○ ○ ○ ○ ○

Index Mundi -- https://www.indexmundi.com/factbook/countries
○
United Nations / National sites -- Environmental Data -- https://unstats.un.org/unsd/environment/clinks.htm
○
World Bank/Country Data -- https://data.worldbank.org/country
○
Environmental Performance Index (EPI) -- https://epi.yale.edu/reports/2016-report
○
Environmental Law -- https://www.globalenvironmentallaw.org/Site/COUNTRY_PROFILES.html
○
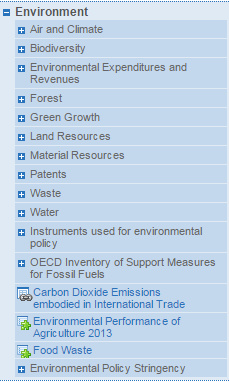
OECD (see Environmental Data) -- https://stats.oecd.org/index.aspx
○


https://mashable.com/2015/06/16/groundwater-aquifers-depleted/
https://touch.latimes.com/#section/-1/article/p2p-83799955/
https://www.nzherald.co.nz/world/news/article.cfm?c_id=2&objectid=11466534
○
- Country
- Maps
- About Us
- Additional Website Resources - Linked Data - Green Best Practices
- Air Quality
- Air Pollution
- Aquifers
- Anthropocene
- Atmospheric Science
- Biodiversity
- Bioneers
- Citizen Science
- Clean Air
- Climate Change
- Climate Policy
- Democratization of Space
- Desertification
- Digital Citizen
- Earth360
- EarthPOV
- Earth Imaging
- Earth Observations
- Earth Law
- Earth Science
- Earth Science from Space
- Earth System Science
- Ecology Studies
- Eco-nomics
- Education
- Environmental Full-cost Accounting
- Environmental Protection
- Environmental Security
- Environmental Security, National Security
- EOS eco Operating System
- ESA
- Externalities
- Forest
- Forests
- Green Best Practices
- GreenPolicy360
- Green Politics
- Health
- Internet
- Land Ethic
- NASA
- Natural Resources
- New Definitions of National Security
- New Space
- NOAA
- Oceans
- Online Education
- Permaculture
- Planet API
- Planet Citizens
- Planet Scientist
- Planet Citizens, Planet Scientists
- PlanetLabs
- Planetary Science
- Population
- Rainforest
- Strategic Demands
- Sustainability
- Sustainability Policies
- ThinBlueLayer
- Virtual Earth
- Virtual Planet
- Water
- Whole Earth
- World Wide Web
- Youth
- Biogeosciences
- Cryosphere
- Geology
- Geophysics
- Geophysics and Geochemistry
- Hydrology
- Mineralogy
- Ocean Science