Category:Ocean Science
<addthis />
2023
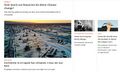
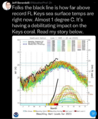
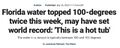
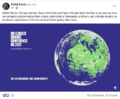
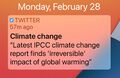
Earth's Oceans Are Warming -- With Profound Impacts on Life
Ninety percent of global warming is now estimated to be occurring in the ocean... the consequences are rippling through earth's watery eco-systems....
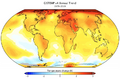
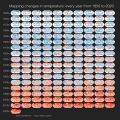
The effects of ocean warming include sea level rise due to thermal expansion, coral bleaching, accelerated melting of Earth’s major ice sheets, intensified hurricanes, and changes in ocean health and biochemistry delivering destruction and extinction


🌎

- Via UNEP | https://nbfn.no/into-the-blue-kelp/
🌎
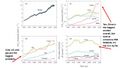
Improved Quantification of the Rate of Ocean Warming
July 15, 2022
Read full article at Journal of Climate, Published Online
Abstract
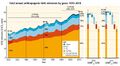
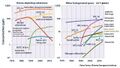
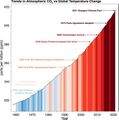
The increased concentrations of greenhouse gases in the atmosphere create an increase in Earth’s thermal energy, which is mainly stored in the ocean. Quantification of the rate of increase in ocean heat content (OHC) is vital for understanding the current and future climate of Earth. Linear trend lines have been frequently used to quantify long-term rates of change, but are inappropriate because they cannot capture nonlinearity in trends, have large start- and end-point sensitivity, and the assumption of linearity is nonphysical. Here observed and model-based linear regressions with higher-order polynomial (quadratic), piecewise linear, and locally weighted scatterplot smoothing (LOWESS) are compared. Piecewise linear and LOWESS perform best in depicting multidecadal trends. It is shown that linear rates are valid for up to about 15-yr segments (i.e., it is valid to compute linear rates within a 15-yr time window). Using the recommended methods, ocean warming for the upper 2000 m increases from about 0 to 0.06 ± 0.08 W m−2 for 1958–73 to 0.58 ± 0.08 W m−2 for 2003–18, indicating an acceleration of ocean warming that happens in all four ocean basins and from near the sea surface to 2000 m. There is consistency between multimodel-mean historically forced climate models and observations, which implies that the contribution of internal variability is small for global 0–2000 m OHC. Notable increases of OHC in the upper ocean (i.e., 0–300 m) after about 1980 and the deeper ocean (300–2000 m) after the late 1980s are also evident. This study suggests alternative methods to those currently used to estimate ocean warming rates to provide a more accurate quantification of long-term Earth’s energy changes.
Significance Statement
Quantifying long-term rates of change is needed to understand the time evolution of ocean warming and to assess the changing ocean and Earth’s energy budgets. Linear trend lines have been frequently used but cannot capture nonlinearity in trends, and have large start- and end-point sensitivity. Based on an analysis of the statistical features of ocean heat content time series, this study proposes two alternative methods to quantify the rates of change, including piecewise linear fit and LOWESS. Robust increases in warming for the upper 2000 m detected through observational records and climate models from 1958 to 2020, indicate a robust acceleration of ocean warming. Slow penetration of heat from the upper ocean into the deeper ocean is also evident.
Abstract-Significance Statement made available via Fair Use
Full article © 2022 American Meteorological Society
○ ○ ○ ○ ○ ○ ○ ○ ○ ○ ○ ○ ○ ○ ○ ○ ○ ○ ○ ○ ○ ○ ○ ○
Report for a Sustainable Ocean Economy
Ocean Solutions that Benefit People, Nature and the Economy
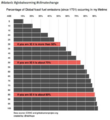
The raw numbers are sobering: ocean waters have absorbed 93 percent of the excess heat caused by greenhouse gas [GHG] emissions and sea surface temperatures have increased by 0.7°C since 1900. New analysis confirms that 2019 was the warmest year on record for ocean temperature, and saw the largest single-year increase of the decade. The 12 years with lowest Arctic sea ice extent all happened in the past dozen years140, and 2017 marked the lowest Antarctic sea ice extent on record.
○ ○ ○ ○ ○ ○ ○ ○ ○ ○ ○ ○ ○ ○ ○ ○ ○ ○
Science on the Seas (SOS)
The 'Tiny Little Ones'


○ ○ ○ ○ ○ ○ ○ ○ ○ ○ ○ ○ ○ ○ ○ ○ ○ ○ ○ ○ ○ ○ ○ ○ ○
Microplastic Pollution Across World Oceans
'Ginormous' Disaster in the Making
"Plastic Particles may outnumber zooplankton, which underpin marine life and regulate climate"
Microplastics have entered the food chain in rivers, with birds found to be consuming hundreds of particles a day via the aquatic insects on which they feed.
Microplastic pollution has contaminated the whole planet, from Arctic snow and mountain soils to many rivers and the deepest oceans. It is also being consumed and inhaled by people, and the health impacts are as yet unknown.
Research published in the last month in the Journal of 'Environmental Pollution' has found microplastics in greater quantities than ever before on the seabed and suggested that hundreds of thousands of tonnes of microplastics could be blowing ashore on the ocean breeze every year...
The Rise of the Jellyfish
Invasion across the oceans of the world
After roaming the oceans for more than a half billion years, jellyfish may finally be poised to overtake Earth's largest bodies of water. A combination of pollution and warming is fostering a perfect environment for the alien-looking creatures to rule the seas.
Thousands of species fall under the jellyfish umbrella, similar only in their basic body composition and tendency in undergoing sudden population booms. Some scientists use the term “gelatinous zooplankton”... Jellyfish may finally be poised to overtake Earth's largest bodies of water.
'Jellymageddon': Can we stop the rise of the jellyfish?
○ ○ ○ ○ ○ ○ ○ ○ ○ ○ ○ ○ ○ ○
Seagrass: A 'Secret Weapon' Against Global Heating
○ ○ ○ ○ ○ ○ ○ ○ ○ ○ ○ ○ ○ ○
Molecular Understanding of Ocean Warming
Peter G. Brewer
July 2019
A grand challenge for ocean chemists in the years ahead lies in the need to tackle the chemical consequences of ocean warming with the same rigor and intensity that has been brought to bear on the physical chemistry of ocean acidification...
The ocean absorbs some 93% of all greenhouse gas‐generated heat, and ocean warming is already creating observable impacts on marine life. To make reliable projections for the future, we cannot rely on Ptolemy‐like rules, built as something to match field observations, to apply in the years to come. Instead, we will need to apply the laws of chemical physics to calculate and predict the changes that ocean warming will have on the physical properties of sea water and the associated impacts on marine life. This includes treating water as a fluid with defined temperature‐and pressure‐dependent chemical structures.
Sea water is 96.5% water, and some 78–85% of water in the oceans has a form with a much higher molecular weight than the water molecule that typically comes to mind, with a single oxygen and two hydrogens. These varied structures are now directly relatable to the high heat capacity of water, why the speed of sound is faster in warmer water, and the viscosity of sea water that provides constraints on microbial motion. Microbial activity is a key driver to the amount of oxygen in different parts of the ocean, and if their activity is affected by increased warmth, it seems quite possible that large regions may exist with no oxygen at all. Marine life responds strongly to changing oxygen status. This is because both warmer waters can hold less oxygen, and because warming drives higher rates of microbial growth.
Marine fisheries, and the great majority of all marine species, are already responding to these forces and are migrating toward cooler waters near the poles. Using known laws of science to connect chemistry, physics, and ocean warming would allow the ocean sciences to proceed on firmer footing and to improve future projections of the impact of ocean warming. The ocean is now experiencing the twinned invasions of heat and fossil fuel carbon dioxide that drive up its acid level. It is the combined impact of these two great waves, both resulting from our use of fossil fuels, that will be critical...
○ ○ ○ ○ ○ ○ ○ ○
Seaweed, not just seaweed but a 'Sea of Seaweed'
Warming oceans produce abundant 'weed'
Satellites tracking 'the weed'
- Satellites in Space Spot Largest Seaweed Bloom on Earth
The great Atlantic Sargassum belt
Floating mats of Sargassum seaweed in the center of the North Atlantic were first reported by Christopher Columbus in the 15th century. These mats, although abundant, have until recently been limited and discontinuous. However, Wang et al. report that, since 2011, the mats have increased in density and aerial extent to generate a 8850-kilometer-long belt that extends from West Africa to the Caribbean Sea and Gulf of Mexico. This represents the world's largest macroalgal bloom. Such recurrent blooms may become the new normal.
Seaweed, seaweed everywhere
Millions of tonnes of floating Sargassum seaweed in coastal waters smother fragile seagrass habitats, suffocate coral reefs and harm fisheries. And once washed ashore on Mexican and Caribbean beaches, this foul-smelling, rotting seaweed goes on to devastate the tourist industry, prevent turtles from nesting and damage coastal ecosystems, while releasing hydrogen sulphide and other toxic gases as it decomposes.
Seaweed blooms are exacerbated by fertilisers washing into the ocean, as well as by warming sea temperatures. “Sargassum blooms on the Atlantic gyre [tidal current] have got much worse in recent years partly due to increasing intensive agriculture discharging fertiliser into the sea via rivers such as the Mississippi and Amazon,” says Prof Mike Allen, of the University of Exeter and Plymouth Marine Laboratory. “Fertiliser makes the seaweed grow faster and this influx of biomass just shouldn’t be there in that abundance – it’s out of control.”
Sargassum: The biggest seaweed bloom in the world
Sargasso Sea (video) from the Smithsonian Channel
○ ○ ○ ○ ○ ○ ○ ○
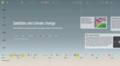
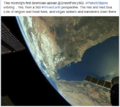
Monitoring Earth's Oceans from Space
- Will the new availability of sophisticated, satellite-based technologies, coupled with the democratization of online data about the health of our environment, help ensure that these positive advancements live up to their potential to protect the oceans?
○ ○ ○ ○ ○ ○ ○ ○
"What percentage of the Earth is covered by oceans?"'
71% -- Via http://www.noaa.gov/oceans-coasts
·······························
Phytoplankton & Photosynthesis
Plankton: The Ocean Food Chain & Atmospheric Oxygen
"Tiny Blue Green"
- More than Meets the Eye
"A single kind of blue-green algae in the ocean produces the oxygen in one of every five breaths we take"
- ~ from "The World Is Blue: How Our Fate and the Ocean’s Are One" by Sylvia Earle
○ ○ ○ ○ ○ ○ ○ ○ ○ ○ ○ ○ ○ ○
Impacts of Ocean Warming /AGU Science - Geophysics
○ ○ ○ ○ ○ ○ ○ ○ ○ ○ ○ ○ ○ ○

Visit:
www.tinybluegreen.com @GreenPolicy360
Seventy percent of the Earth's surface is ocean and here, in myriad life forms, "tiny blue-green" organisms are essential to preserving life on the planet.
○ ○ ○ ○ ○ ○ ○ ○
Join in Planet Scientists, do some difference-making Citizen Science
○ ○ ○ ○ ○ ○ ○ ○
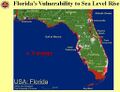
Sea-Level Rise
○ ○ ○ ○ ○ ○ ○ ○
Mapping & Tracking
○ ○ ○ ○ ○ ○ ○ ○

Open Science Access to Ocean Research
○ ○ ○ ○ ○ ○ ○ ○


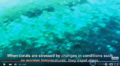
Global Impacts of Ocean Acidification and Warming
- To gather a more comprehensive understanding of the condition of global reef ecosystems, we need a way to assess and monitor them on a large geographic scale.
- The Reefscape project aims to improve our understanding of the condition of coral reefs worldwide, while simultaneously developing spectral libraries needed to advance the development of a new satellite mission.
- New satellites, such as those from Planet (formerly Planet Labs), are, as of 2017, able to capture near-daily imagery of coral reefs worldwide. Planet’s high-resolution imagery of reef locations provides new imaging, science and understanding of the composition and extent of shallow, horizontally oriented reefs.


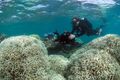
Reefs and Coral, sentinel species
Coral reefs in peril as ocean environment is transformed
○

Ocean Research Missions - http://schmidtocean.org/
○


○
Subcategories
This category has the following 21 subcategories, out of 21 total.
A
B
C
E
F
G
N
O
P
S
T
W
Pages in category "Ocean Science"
The following 97 pages are in this category, out of 97 total.
A
C
- Carbon Brief
- Citizen Science
- Climate Change - Global Warming Keyword-Terms
- Climate Change Denier Talking Points -- and Rebuttals
- Climate Change Summit Paris
- Climate Desk
- Climate Law Blog @Columbia Law School
- Climate migration
- Climate News
- Climate News Events Archive ... 1970 to Today
- Climate Plans Enforcement - Resources
- Copernicus EU
E
- Earth and Space, Politics
- Earth at Night
- Earth from NASA
- Earth Imaging-New Space
- Earth Right Now
- Earth Science
- Earth Science Eco-Fields
- Earth Science Research from Space
- Earth Science Vital Signs
- EarthTime
- Ecolivia
- Environmental agreements
- Environmental movement
- Environmental protection
- Environmental Rules Rolled Back
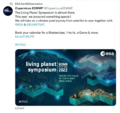
- ESA Living Planet Announcement - May 2022
- Ethics and Climate Change
- European Union Green Deal - Fit for 55
- Extinction
- ExxonMobil and US House Science Committee v US Attorneys General and Environmental Groups
G
- Glasgow Climate Summit - Pledges, Promises, Declarations - What's Next Up
- Global Climate Action Summit
- Global Fishing Watch
- Global warming
- Google Earth
- GP360 NewPages
- Green Marketing
- Green Stories of the Day
- Green Stories of the Day - GreenPolicy360 Archive
- GreenPolicy360 Archive Highlights 2013
- GreenPolicy360 Archive Highlights 2014
- GreenPolicy360 Archive Highlights 2015
- GreenPolicy360 Archive Highlights 2016
- GreenPolicy360 Archive Highlights 2017
- GreenPolicy360 Archive Highlights 2018
- GreenPolicy360 Archive Highlights 2019
- GreenPolicy360 Archive Highlights 2020
- GreenPolicy360 Archive Highlights 2023
- GreenPolicy360 Highlights
P
S
U
Media in category "Ocean Science"
The following 200 files are in this category, out of 786 total.
(previous page) (next page) Earthview nasa date-unknown search1.jpg 768 × 432; 79 KB
 Economist.com global capital snapshot as of July 2020.jpg 800 × 477; 119 KB
 Eiffel tower green.jpg 759 × 422; 28 KB
 Elon Musk quote - gas externality price.png 680 × 320; 199 KB
 Emissions graph - gleick tw 2018.jpg 640 × 364; 37 KB
 Energy Charter Treaty.jpg 512 × 480; 74 KB
 Energy Imbalance, Climate Change - Aug 1 2021.png 640 × 672; 394 KB
 Env policy laws US 'the beginning' of env era.jpg 370 × 345; 65 KB
 Environmental laws in US - Supreme Court votes soon.png 800 × 414; 334 KB
 Environmental Security ThinBlueLayer.png 814 × 677; 469 KB
 EnvirSecurity.png 558 × 166; 155 KB
 EO and Fire Ants in the US - on World Wildlife Day.png 768 × 811; 663 KB
 EPA History Xin Liu-2010.pdf ; 2.88 MB
 EPA website a 'ghost page' now.png 667 × 233; 45 KB
 ESA ers2-envisats-tandem s.jpg 451 × 298; 34 KB
 ESA Living Planet Symposium - Announcement.png 637 × 600; 508 KB
 ESA Living Planet Symposium - May 2022.png 700 × 600; 258 KB
 ESG Fight - Feb 2023.png 396 × 194; 88 KB
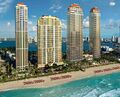 Estates at Acqualina - Sunny Isles Miami.jpg 746 × 600; 117 KB
 Estuary in Clearwater on Tampa Bay.jpg 3,584 × 2,016; 1.5 MB
 EU agrees to cut emissions 55 percent by 2030.jpg 800 × 558; 96 KB
 EU unveils new climate change policy - July 14 2021 - 1.jpg 800 × 234; 33 KB
 EU unveils new climate change policy - July 14 2021 - 2.jpg 800 × 552; 86 KB
 EU unveils new climate change policy - July 14 2021 - 3.jpg 800 × 549; 89 KB
 EU unveils new climate change policy - July 14 2021 - 4.jpg 800 × 550; 92 KB
 EU unveils new climate change policy - July 14 2021 - 5.jpg 800 × 548; 88 KB
 EU unveils new climate change policy - July 14 2021 - 6.jpg 800 × 557; 89 KB
 EU unveils new climate change policy - July 14 2021 - 7.jpg 800 × 553; 92 KB
 EU unveils new climate change policy - July 14 2021 - 8.jpg 800 × 589; 91 KB
 Eukaryotic Cell SCU.jpg 716 × 1,024; 799 KB
 Eunice Foote Illustration climate.gov.jpg 620 × 296; 55 KB
 Europe heat wave - July 19 2022 - via Copernicus satellite.png 600 × 639; 704 KB
 ExxonMobil CO2 climatic response study - Graphic 1 - 1982.png 537 × 680; 150 KB
 ExxonMobil CO2 climatic response study - Graphic 2 - 1982.png 537 × 605; 112 KB
 FaceApp Florida.jpg 640 × 428; 40 KB
 Fact Checking organizations at work.jpg 800 × 390; 44 KB
 Facts Count-WaPo Reports-19127 false-misleading claims in 1226 days.jpg 601 × 489; 100 KB
 Feeling the Heat 1989.png 800 × 1,095; 400 KB
 Fire Ants.png 601 × 600; 603 KB
 Floating adaptations - GCA - for sea-level rise - circa 2023.png 600 × 732; 273 KB
 Floating Forest Project .png 773 × 461; 932 KB
 Floating Forest Project.png 1,106 × 604; 1,020 KB
 Floating Forests-Kelp -- Oceanlight.jpg 720 × 480; 137 KB
 Florida Keys sea surface temps for 2023 (as of July).png 480 × 585; 287 KB
 Florida ocean water temp south of Everglades tops 99 F. degrees.png 480 × 564; 128 KB
 Florida sea rise ab.jpg 256 × 197; 12 KB
 Florida sea surface water in the Keys area tops 100 degree F.jpg 640 × 257; 58 KB
 Florida-sea-level-rise.jpg 400 × 400; 125 KB
 Foley on March29,2017.png 487 × 135; 0 bytes
 FOOD.jpg 983 × 311; 117 KB
 Fox on Earth Day 2023.jpg 640 × 275; 58 KB
 From 1968 to 1992 -- and the Journey continues....png 572 × 851; 320 KB
 From Reid Wiseman Earth Ocean Patterns.png 941 × 578; 715 KB
 G Earth Outreach.jpg 800 × 412; 44 KB
 Gavin in Glasgow - Nov 10 2021.png 728 × 600; 378 KB
 GCAS original.png 800 × 504; 94 KB
 GCAS-2.jpg 800 × 450; 136 KB
 GHG emissions 1970-2010.jpg 800 × 438; 50 KB
 GHG forcings 1750-2020.png 531 × 531; 94 KB
 GHG ppt concentrations 1975-2020.jpg 640 × 361; 69 KB
 Gistemp 1979-2019.png 750 × 491; 335 KB
 Glasgow-Climate Conference News-Nov 6, 2021.png 600 × 800; 290 KB
 Global Biodiversity Information-Data.png 501 × 266; 124 KB
 Global Changes in temperature 1850-2020.jpg 480 × 480; 152 KB
 Global climate conferences and GHG increases.jpg 793 × 801; 56 KB
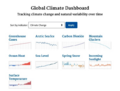 Global Climate Dashboard - NOAA - Climate.gov.png 630 × 480; 165 KB
 Global climate dashboard-NOAA climate.gov.jpg 521 × 221; 45 KB
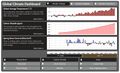 Global climate dashboard-www.climate.gov.jpg 800 × 489; 100 KB
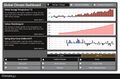 Global Climate Dashboard.jpg 800 × 529; 101 KB
 Global Climate Strike - RU.jpg 450 × 804; 116 KB
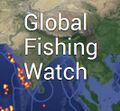 Global Fishing Watch 2.jpg 266 × 247; 26 KB
 Global fossil fuel emissions - in a lifetime graphic.png 600 × 657; 233 KB
 Global greenhouse gas emissions - 1980 - 2020.png 640 × 480; 158 KB
 Global Primary Energy Consumption - 1800-2017.jpg 800 × 583; 65 KB
 Global Stocktake, the first GST.jpg 800 × 905; 513 KB
 Global temperature change 1850-2016.gif 512 × 288; 1.38 MB
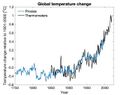 Global temperature change 1901-2000.jpg 640 × 508; 47 KB
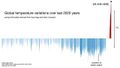 Global temperature variations over past 200 years.jpg 640 × 360; 29 KB
 GlobalClimateStrike-March15,2019.jpg 600 × 613; 30 KB
 Globally-averaged temps thru 2015 via NASA Goddard.gif 480 × 270; 1.76 MB
 GND next steps.png 567 × 660; 304 KB
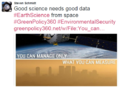 Good science needs good data .png 579 × 420; 223 KB
 Google Earth Hello2.png 800 × 375; 863 KB
 Great Barrier Reef dying.jpg 1,920 × 1,280; 706 KB
 Great Barrier Reef May 2016 m.png 700 × 196; 170 KB
 Great Barrier Reef May 2016.png 771 × 213; 182 KB
 Great Barrier Reef severe bleaching die-off.png 704 × 388; 630 KB
 Great-barrier-reef-2011 image credit, mike mccoy.jpg 2,560 × 1,600; 3.91 MB
 Green dragon over Iceland 2015 Belegurshi.jpg 960 × 960; 57 KB
 Green New Deal, work in progress.jpg 800 × 450; 62 KB
 Greenhouse gas levels hit record - Reuters.jpg 600 × 696; 104 KB
 Greenland ice sheet set to raise sea level significantly.png 640 × 340; 223 KB
 GreenLinks logo - 2.png 451 × 84; 13 KB
 GreenLinks logo.png 644 × 120; 10 KB
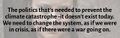 Greta - the politics thats needed.jpg 639 × 203; 38 KB
 Greta anger into action.png 800 × 419; 528 KB
 Greta Looks Back.PNG 504 × 437; 368 KB
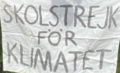 Greta Thunberg - Week 203 Climate Strike Banner.png 209 × 127; 51 KB
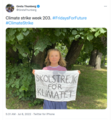 Greta Thunberg - Week 203 Climate Strike.png 554 × 601; 488 KB
 Guarding Earths Water - from Space.jpg 578 × 496; 102 KB
- Gulf Stream in Critical Danger.pdf ; 181 KB
 Haiku poems - Owl against a dusk sky - via Haiku Foundation.png 514 × 413; 144 KB
 Haikubox via RM citizen science.png 600 × 640; 466 KB
 Harvey-NOAA.jpg 960 × 643; 173 KB
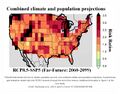 Heat stress in US may double by end of century.jpg 640 × 503; 107 KB
 High Seas Treaty agreement - March 4 2023.png 617 × 498; 53 KB
 Himawari Earth water vapor dynamics.png 768 × 774; 917 KB
 Historic climate-clean energy vote in US Congress August 12 2022.jpeg 800 × 775; 384 KB
 Historic photographs - Humble Oil TX - Exxon.png 591 × 596; 548 KB
 Hotimes.png 514 × 481; 201 KB
 Hourglass-sand-2.jpg 450 × 342; 12 KB
 House passes biggest climate investment in U.S. history.png 625 × 480; 114 KB
 How satellites monitor climate change circa 2016.png 599 × 327; 0 bytes
 How thin is earth's atmosphere.jpg 605 × 292; 61 KB
 Huge heat anomaly in 2023 - by Gavin Schmidt.png 735 × 857; 172 KB
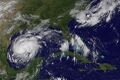
 Hurricanes - Typhoons via NASA data.png 764 × 924; 1,022 KB
 I Am Greta - the Documentary.jpg 387 × 485; 30 KB
 I Am Greta Marching.jpg 800 × 534; 80 KB
 I dont believe it.png 675 × 315; 50 KB
 I've done all I can.png 584 × 101; 19 KB
 Ice loss West Antarctica 1992-2019.jpg 680 × 611; 85 KB
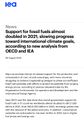 IEA - Support for Fossil Fuels - re 2021.jpg 559 × 800; 143 KB
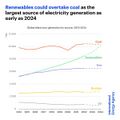 IEA energy chart - 2023.jpg 600 × 600; 68 KB
 IEA News 1.jpg 480 × 400; 64 KB
 IEA News 2.jpg 480 × 475; 55 KB
 IEA News 3.jpg 480 × 496; 57 KB
 IEA News 4.jpg 480 × 530; 57 KB
 IEA News 5.jpg 480 × 539; 62 KB
 Image3.png 196 × 30; 2 KB
 In nature, nothing exists alone.jpg 500 × 357; 26 KB
 In the smallest creatures god.png 748 × 149; 232 KB
 INaturalist butterfly.jpg 1,024 × 683; 202 KB
 INDCs as of Nov28,2015.png 482 × 52; 11 KB
 Infrastructure Bill and Climate Resilience - A Step Forward.png 640 × 403; 526 KB
 IPCC Report - Feb 2022.jpg 448 × 291; 113 KB
 IPCC report August 9-2021 (1).jpg 745 × 380; 156 KB
 IPCC report August 9-2021 (2).jpg 745 × 428; 171 KB
 ISS sunrise from space.jpg 1,024 × 768; 36 KB
 It's hot in South Florida - July 2023.jpg 480 × 537; 92 KB
 It's Hot the Times UK Says... Act Now or else - July 2022.png 800 × 416; 568 KB
 Jacinda - New Zealand.jpg 533 × 523; 64 KB
 January-May 2020 temp anomaly.jpg 680 × 380; 54 KB
 Jason3-16-2.jpg 600 × 236; 54 KB
 Jerry Brown re EPA - 19 June 2019.jpg 699 × 798; 126 KB
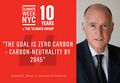
 Jerry Brown-Climate Week, NYC, Sept2018.jpg 800 × 534; 242 KB
 Jerry Brown-Global Climate Action Summit.png 800 × 453; 900 KB
 Jerry-Brown-quote.jpg 800 × 552; 69 KB
 Joe Biden is projected winner Nov7-2020.jpg 343 × 120; 26 KB
 John Kerry - Climate Envoy - 2021-09-26.png 640 × 410; 349 KB
 Jorge Leon Arellano OPEC-Energy Demand Presentation-CSIS-Dec2016.png 700 × 394; 351 KB
 Journey of a Climate Pixel - May 2022.png 800 × 399; 114 KB
 July 14, 2018 - hello down there.png 524 × 467; 290 KB
 June 2019 - NASA GISS data - hottest on record.jpg 640 × 560; 58 KB
 Katharine Hayhoe - Nov 26, 2019.jpg 508 × 466; 80 KB
 Kelp forest off Calif coast collapsing.jpg 773 × 681; 155 KB
 Kelp NOAA credit Robert Schwemmer.jpg 450 × 299; 193 KB
 Keystone to Enridge - McKibben - June 11, 2021.jpg 512 × 559; 140 KB
 Kim Cobb - Georgia Tech professor of climate science.jpeg 800 × 533; 87 KB
 LA Times - July 2023 on the world's response to the climate crisis-1a.png 800 × 1,011; 657 KB
 LA Times on the world's response to the climate crisis-2.png 800 × 651; 297 KB
 LA Times on the world's response to the climate crisis-3.png 800 × 806; 302 KB
 LA Times on the world's response to the climate crisis-4.png 800 × 896; 321 KB
 Lamar accuses March 2017.png 800 × 439; 245 KB
 Lamar re science and Trumps truth.png 627 × 607; 206 KB
 Lamar Smith Denial Offensive.png 393 × 307; 224 KB
 Lamar's science.png 584 × 537; 204 KB
 LANDSAT - NASA.jpg 622 × 415; 95 KB
 Landsat 50th anniv Sept 2016.jpg 800 × 456; 94 KB
 Landsat 9 about to launch.png 420 × 721; 355 KB
 Landsat 9 Launches - 1.jpg 600 × 693; 128 KB
 Landsat 9 Launches - 2.jpg 600 × 737; 250 KB
 Landsat at 50.png 800 × 713; 345 KB
 Landsat memories.png 535 × 473; 159 KB
 Launch into Space.jpg 800 × 717; 50 KB
 Launching soon.png 657 × 468; 225 KB
 LDCs face the climate crisis, raise the alarm - Nov 2021.png 419 × 226; 126 KB
 Le Grand Bleu.png 738 × 1,107; 1.52 MB
 Like a speeding freight train.png 640 × 600; 492 KB
 Living Earth.png 441 × 183; 106 KB
 Living-Shoreline.png 800 × 367; 128 KB
 LivingEarth2.png 800 × 503; 478 KB
 LivingShorelines Graph.png 680 × 375; 73 KB
 LMDCs make their case at the Glasgow climate summit.png 427 × 480; 259 KB
 M Channel Envisioning the Future 4.png 700 × 845; 246 KB
 Manchin kills the Biden climate plan.jpg 800 × 438; 71 KB
 Manchin News - Dec 20 2021.png 600 × 588; 307 KB
 Manchin News 2 - Dec 20 2021.png 600 × 600; 329 KB
 Mangroves regulate flooding - EDF.png 568 × 473; 328 KB
 Map of the World wiki commons m.png 679 × 314; 18 KB
 Map of the World wiki commons s.png 339 × 157; 13 KB
 Map of the World wiki commons.png 1,357 × 628; 19 KB
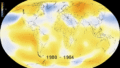
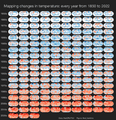 Mapping changes in global temperature 1850-2022.png 656 × 680; 180 KB
 Mapping the Earth with Google Earth Outreach.jpg 640 × 648; 109 KB


.png)


.jpg)
.jpg)


.png)


