File:US Annual Temperatures 1901-2020 Average Comparison.jpg: Difference between revisions
Siterunner (talk | contribs) No edit summary |
Siterunner (talk | contribs) No edit summary |
||
| Line 1: | Line 1: | ||
<big>NOAA's "new normal" climate report is anything but normal</big> | |||
By Jeff Berardelli | |||
May 8, 2021 / 7:11 AM / CBS News | |||
* https://www.cbsnews.com/news/climate-change-new-normal-temperature-noaa/ | |||
''It doesn't take a climate scientist to see the changes that have occurred. In the maps below, using NOAA data, Climate Central illustrates the warmer temperatures the U.S. has experienced. When comparing the latest "normals" to what used to be normal a century ago, the difference is clear — seen in red from coast to coast...'' | |||
''Some climate scientists, like Michael Mann of Penn State, don't love the system of reporting new normals. As he told The Associated Press, Mann prefers using a constant baseline because updating what is normal for present-day conditions obscures the long-term warming trend and makes the warming due to climate change seem less significant. "Adjusting normal every 10 years perverts the meaning of 'normal' and 'normalizes' away climate change." | |||
[[File:US Annual Temperatures 1901-2020 Average Comparison.jpg]] | |||
<big>US Climate Normals</big> | |||
''The U.S. Climate Normals are a large suite of data products that provide information about typical climate conditions for thousands of locations across the United States. Normals act both as a ruler to compare today’s weather and tomorrow’s forecast, and as a predictor of conditions in the near future. The official normals are calculated for a uniform 30 year period, and consist of annual/seasonal, monthly, daily, and hourly averages and statistics of temperature, precipitation, and other climatological variables from almost 15,000 U.S. weather stations.'' | |||
''National Centers for Environmental Information (NCEI) generates the official U.S. normals every 10 years in keeping with the needs of our user community and the requirements of the World Meteorological Organization (WMO) and National Weather Service (NWS). The 1991–2020 U.S. Climate Normals are the latest in a series of decadal normals first produced in the 1950s. These data allow travelers to pack the right clothes, farmers to plant the best crop varieties, and utilities to plan for seasonal energy usage. Many other important economic decisions that are made beyond the predictive range of standard weather forecasts are either based on or influenced by climate normals.'' | |||
* https://www.ncei.noaa.gov/products/us-climate-normals | |||
* https://www.ncei.noaa.gov/about | |||
○ | |||
[[Category:Air Quality]] | |||
[[Category:Air Pollution]] | |||
[[Category:Agriculture]] | |||
[[Category:Alternative Agriculture]] | |||
[[Category:Antarctica]] | |||
[[Category:Anthropocene]] | |||
[[Category:Arctic]] | |||
[[Category:Atmospheric Science]] | |||
[[Category:Citizen Science]] | |||
[[Category:City Governments]] | |||
[[Category:Climate Change]] | |||
[[Category:Climate Migration]] | |||
[[Category:Climate Policy]] | |||
[[Category:County Governments]] | |||
[[Category:Desertification]] | |||
[[Category:Digital Citizen]] | |||
[[Category:Earth Imaging]] | |||
[[Category:Earth Observations]] | |||
[[Category:Earth360]] | |||
[[Category:Earth Science]] | |||
[[Category:Earth Science from Space]] | |||
[[Category:Earth System Science]] | |||
[[Category:Ecology Studies]] | |||
[[Category:Eco-nomics]] | |||
[[Category:Economic Justice]] | |||
[[Category:Education]] | |||
[[Category:Energy]] | |||
[[Category:Environmental Laws]] | |||
[[Category:Environmental Protection]] | |||
[[Category:Environmental Security]] | |||
[[Category:Environmental Security, National Security]] | |||
[[Category:ESA]] | |||
[[Category:European Union]] | |||
[[Category:Externalities]] | |||
[[Category:Extinction]] | |||
[[Category:Florida]] | |||
[[Category:Food]] | |||
[[Category:Forests]] | |||
[[Category:Fossil Fuels]] | |||
[[Category:Greenland]] | |||
[[Category:Global Security]] | |||
[[Category:Global Warming]] | |||
[[Category:Green Networking]] | |||
[[Category:Green Best Practices]] | |||
[[Category:Green Graphics]] | |||
[[Category:Green Politics]] | |||
[[Category:Health]] | |||
[[Category:INDC]] | |||
[[Category:Maps]] | |||
[[Category:Money in Politics]] | |||
[[Category:NASA]] | |||
[[Category:NOAA]] | |||
[[Category:Natural Resources]] | |||
[[Category:Networking]] | |||
[[Category:New Definitions of National Security]] | |||
[[Category:New Economy]] | |||
[[Category:New Space]] | |||
[[Category:Oceans]] | |||
[[Category:Ocean Science]] | |||
[[Category:Online Education]] | |||
[[Category:Planet Citizen]] | |||
[[Category:Planet Citizens]] | |||
[[Category:Planet Citizens, Planet Scientists]] | |||
[[Category:Rainforest]] | |||
[[Category:Renewable Energy]] | |||
[[Category:Resilience]] | |||
[[Category:Sea-level Rise]] | |||
[[Category:Sea-Level Rise & Mitigation]] | |||
[[Category:Social Justice]] | |||
[[Category:Soil]] | |||
[[Category:Solar Energy]] | |||
[[Category:Strategic Demands]] | |||
[[Category:Sustainability Policies]] | |||
[[Category:Threat Multiplier]] | |||
[[Category:United Nations]] | |||
[[Category:US]] | |||
[[Category:US Environmental Protection Agency]] | |||
[[Category:Water Quality]] | |||
[[Category:Whole Earth]] | |||
[[Category:Wind Energy]] | |||
[[Category:World Bank]] | |||
[[Category:World Wide Web]] | |||
[[Category:Youth]] | |||
Revision as of 17:01, 9 May 2021
NOAA's "new normal" climate report is anything but normal
By Jeff Berardelli
May 8, 2021 / 7:11 AM / CBS News
It doesn't take a climate scientist to see the changes that have occurred. In the maps below, using NOAA data, Climate Central illustrates the warmer temperatures the U.S. has experienced. When comparing the latest "normals" to what used to be normal a century ago, the difference is clear — seen in red from coast to coast...
Some climate scientists, like Michael Mann of Penn State, don't love the system of reporting new normals. As he told The Associated Press, Mann prefers using a constant baseline because updating what is normal for present-day conditions obscures the long-term warming trend and makes the warming due to climate change seem less significant. "Adjusting normal every 10 years perverts the meaning of 'normal' and 'normalizes' away climate change."

US Climate Normals
The U.S. Climate Normals are a large suite of data products that provide information about typical climate conditions for thousands of locations across the United States. Normals act both as a ruler to compare today’s weather and tomorrow’s forecast, and as a predictor of conditions in the near future. The official normals are calculated for a uniform 30 year period, and consist of annual/seasonal, monthly, daily, and hourly averages and statistics of temperature, precipitation, and other climatological variables from almost 15,000 U.S. weather stations.
National Centers for Environmental Information (NCEI) generates the official U.S. normals every 10 years in keeping with the needs of our user community and the requirements of the World Meteorological Organization (WMO) and National Weather Service (NWS). The 1991–2020 U.S. Climate Normals are the latest in a series of decadal normals first produced in the 1950s. These data allow travelers to pack the right clothes, farmers to plant the best crop varieties, and utilities to plan for seasonal energy usage. Many other important economic decisions that are made beyond the predictive range of standard weather forecasts are either based on or influenced by climate normals.
○
File history
Click on a date/time to view the file as it appeared at that time.
| Date/Time | Thumbnail | Dimensions | User | Comment | |
|---|---|---|---|---|---|
| current | 16:57, 9 May 2021 | 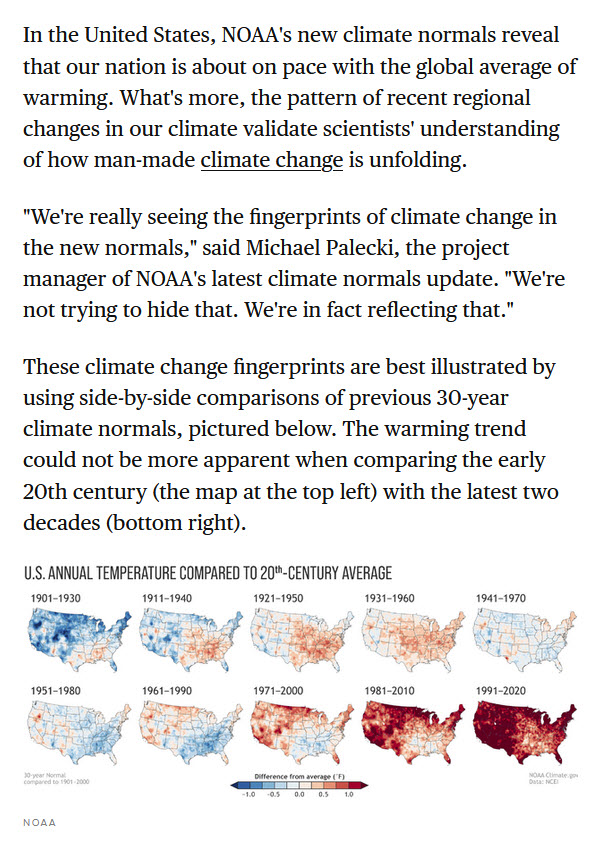 | 604 × 843 (242 KB) | Siterunner (talk | contribs) |
You cannot overwrite this file.
File usage
- Air Quality
- Air Pollution
- Agriculture
- Alternative Agriculture
- Antarctica
- Anthropocene
- Arctic
- Atmospheric Science
- Citizen Science
- City Governments
- Climate Change
- Climate Migration
- Climate Policy
- County Governments
- Desertification
- Digital Citizen
- Earth Imaging
- Earth Observations
- Earth360
- Earth Science
- Earth Science from Space
- Earth System Science
- Ecology Studies
- Eco-nomics
- Economic Justice
- Education
- Energy
- Environmental Laws
- Environmental Protection
- Environmental Security
- Environmental Security, National Security
- ESA
- European Union
- Externalities
- Extinction
- Florida
- Food
- Forests
- Fossil Fuels
- Greenland
- Global Security
- Global Warming
- Green Networking
- Green Best Practices
- Green Graphics
- Green Politics
- Health
- INDC
- Maps
- Money in Politics
- NASA
- NOAA
- Natural Resources
- Networking
- New Definitions of National Security
- New Economy
- New Space
- Oceans
- Ocean Science
- Online Education
- Planet Citizen
- Planet Citizens
- Planet Citizens, Planet Scientists
- Rainforest
- Renewable Energy
- Resilience
- Sea-level Rise
- Sea-Level Rise & Mitigation
- Social Justice
- Soil
- Solar Energy
- Strategic Demands
- Sustainability Policies
- Threat Multiplier
- United Nations
- US
- US Environmental Protection Agency
- Water Quality
- Whole Earth
- Wind Energy
- World Bank
- World Wide Web
- Youth