File:Like a speeding freight train.png: Difference between revisions
Siterunner (talk | contribs) No edit summary |
Siterunner (talk | contribs) No edit summary |
||
| (2 intermediate revisions by the same user not shown) | |||
| Line 1: | Line 1: | ||
* https://www.nytimes.com/2018/12/05/climate/greenhouse-gas-emissions-2018.html | |||
''Greenhouse gas emissions worldwide are growing at an accelerating pace this year, researchers said Wednesday (December 5, 2018), putting the world on track to face some of the most severe consequences of global warming sooner than expected.'' | |||
''Scientists described the quickening rate of carbon dioxide emissions in stark terms, comparing it to a “speeding freight train” and laying part of the blame on an unexpected surge in the appetite for oil as people around the world not only buy more cars but also drive them farther than in the past — more than offsetting any gains from the spread of electric vehicles.'' | |||
''“We’ve seen oil use go up five years in a row,” said Rob Jackson, a professor of earth system science at Stanford and an author of one of two studies published Wednesday. “That’s really surprising.”'' | |||
''Worldwide, carbon emissions are expected to increase by 2.7 percent in 2018, according to the new research, which was published by the Global Carbon Project, a group of 100 scientists from more than 50 academic and research institutions and one of the few organizations to comprehensively examine global emissions numbers. Emissions rose 1.6 percent last year, the researchers said, ending a three-year plateau.'' | |||
···························································· | |||
Peter Gleick | |||
* https://twitter.com/PeterGleick/status/1070431365764603904 | |||
Thread: | |||
A few thoughts about the new, depressing, carbon budget/CO2 emissions report. | |||
1/3 | |||
Global Carbon Budget 2018 https://www.earth-syst-sci-data.net/10/2141/2018/ | |||
5 Dec 2018 | |||
2/3 | |||
Here's a great graphic showing where carbon emissions come from (top) and where they go. They come from fossil fuels and land use changes (agriculture and deforestation and fires); and they go into the atmosphere and oceans and soil/vegetation. #climate | |||
[[File:Where carbon emission come from - gleick tw 2018.jpg]] | |||
3/3 | |||
These graphs show fossil fuel contributions (bottom left); total national emissions (upper right); & per person emissions (lower right). While most media are only showing the massive Chinese/India emissions, the US is BY FAR the largest carbon polluter, per person. #climate | |||
[[File:Emissions graph - gleick tw 2018.jpg]] | |||
[[Category:Antarctica]] | |||
[[Category:Anthropocene]] | |||
[[Category:Arctic]] | |||
[[Category:Atmospheric Science]] | |||
[[Category:Climate Change]] | |||
[[Category:Climate Migration]] | |||
[[Category:Climate Policy]] | |||
[[Category:Desertification]] | |||
[[Category:Digital Citizen]] | |||
[[Category:Earth Imaging]] | |||
[[Category:Earth Observations]] | |||
[[Category:Earth360]] | |||
[[Category:Earth Science]] | |||
[[Category:Earth Science from Space]] | |||
[[Category:Earth System Science]] | |||
[[Category:Ecology Studies]] | |||
[[Category:Eco-nomics]] | |||
[[Category:Education]] | |||
[[Category:Energy]] | |||
[[Category:Environmental Laws]] | |||
[[Category:Environmental Protection]] | |||
[[Category:Environmental Security]] | |||
[[Category:Environmental Security, National Security]] | |||
[[Category:ESA]] | |||
[[Category:European Union]] | |||
[[Category:Extinction]] | |||
[[Category:Fossil Fuels]] | |||
[[Category:Greenland]] | |||
[[Category:Global Security]] | |||
[[Category:Global Warming]] | |||
[[Category:Green Networking]] | |||
[[Category:Green Politics]] | |||
[[Category:INDC]] | |||
[[Category:Money in Politics]] | |||
[[Category:NASA]] | |||
[[Category:NOAA]] | |||
[[Category:Natural Resources]] | |||
[[Category:Networking]] | |||
[[Category:New Definitions of National Security]] | |||
[[Category:Ocean Science]] | |||
[[Category:Planet Citizen]] | |||
[[Category:Planet Citizens]] | |||
[[Category:Planet Citizens, Planet Scientists]] | |||
[[Category:Renewable Energy]] | |||
[[Category:Resilience]] | |||
[[Category:Sea-level Rise]] | |||
[[Category:Sea-Level Rise & Mitigation]] | |||
[[Category:Solar Energy]] | |||
[[Category:Strategic Demands]] | |||
[[Category:Sustainability Policies]] | |||
[[Category:US Environmental Protection Agency]] | |||
[[Category:Whole Earth]] | |||
[[Category:Wind Energy]]] | |||
[[Category:World Wide Web]] | |||
Latest revision as of 16:19, 6 December 2018
Greenhouse gas emissions worldwide are growing at an accelerating pace this year, researchers said Wednesday (December 5, 2018), putting the world on track to face some of the most severe consequences of global warming sooner than expected.
Scientists described the quickening rate of carbon dioxide emissions in stark terms, comparing it to a “speeding freight train” and laying part of the blame on an unexpected surge in the appetite for oil as people around the world not only buy more cars but also drive them farther than in the past — more than offsetting any gains from the spread of electric vehicles.
“We’ve seen oil use go up five years in a row,” said Rob Jackson, a professor of earth system science at Stanford and an author of one of two studies published Wednesday. “That’s really surprising.”
Worldwide, carbon emissions are expected to increase by 2.7 percent in 2018, according to the new research, which was published by the Global Carbon Project, a group of 100 scientists from more than 50 academic and research institutions and one of the few organizations to comprehensively examine global emissions numbers. Emissions rose 1.6 percent last year, the researchers said, ending a three-year plateau.
····························································
Peter Gleick
Thread:
A few thoughts about the new, depressing, carbon budget/CO2 emissions report.
1/3
Global Carbon Budget 2018 https://www.earth-syst-sci-data.net/10/2141/2018/
5 Dec 2018
2/3
Here's a great graphic showing where carbon emissions come from (top) and where they go. They come from fossil fuels and land use changes (agriculture and deforestation and fires); and they go into the atmosphere and oceans and soil/vegetation. #climate

3/3
These graphs show fossil fuel contributions (bottom left); total national emissions (upper right); & per person emissions (lower right). While most media are only showing the massive Chinese/India emissions, the US is BY FAR the largest carbon polluter, per person. #climate
 ]
]
File history
Click on a date/time to view the file as it appeared at that time.
| Date/Time | Thumbnail | Dimensions | User | Comment | |
|---|---|---|---|---|---|
| current | 16:01, 6 December 2018 | 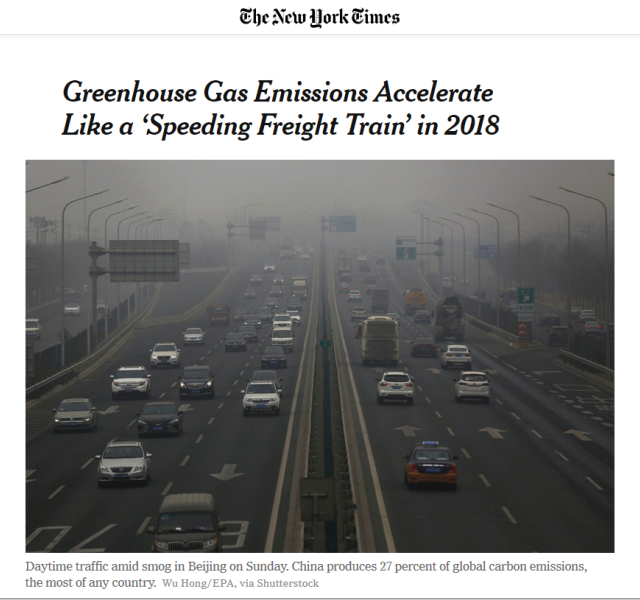 | 640 × 600 (492 KB) | Siterunner (talk | contribs) |
You cannot overwrite this file.
File usage
The following 2 pages use this file:
- Antarctica
- Anthropocene
- Arctic
- Atmospheric Science
- Climate Change
- Climate Migration
- Climate Policy
- Desertification
- Digital Citizen
- Earth Imaging
- Earth Observations
- Earth360
- Earth Science
- Earth Science from Space
- Earth System Science
- Ecology Studies
- Eco-nomics
- Education
- Energy
- Environmental Laws
- Environmental Protection
- Environmental Security
- Environmental Security, National Security
- ESA
- European Union
- Extinction
- Fossil Fuels
- Greenland
- Global Security
- Global Warming
- Green Networking
- Green Politics
- INDC
- Money in Politics
- NASA
- NOAA
- Natural Resources
- Networking
- New Definitions of National Security
- Ocean Science
- Planet Citizen
- Planet Citizens
- Planet Citizens, Planet Scientists
- Renewable Energy
- Resilience
- Sea-level Rise
- Sea-Level Rise & Mitigation
- Solar Energy
- Strategic Demands
- Sustainability Policies
- US Environmental Protection Agency
- Whole Earth
- Wind Energy
- World Wide Web