File:Bloomberg Live Climate Data Dashboard.jpg: Difference between revisions
Siterunner (talk | contribs) No edit summary |
Siterunner (talk | contribs) No edit summary |
||
| Line 1: | Line 1: | ||
<addthis /> | |||
| |||
<big><big><big>'''''Bloomberg Data Dash:'''''</big></big></big> | |||
<big>A Live Climate Scoreboard for the World</big> | |||
''Via Bloomberg Green: These are the numbers that matter. A difficult global transition is happening right now, away from fossil fuels, deforestation, greenhouse-gas pollution and melting ice. It can be measured with precision and clarity. The processes described by this data dashboard are occurring on a planetary scale, and yet our progress can be measured this minute, in parts per million, in metric tons, in fractions of a degree. This is Bloomberg Green’s guide to the worldwide goal of slowing and stopping warming temperatures. This is a record of how far we have to go, and a tool to assess how much we can change.'' | |||
<big>Carbon Clock</big> | |||
Scientists have measured the rising level of carbon dioxide in the atmosphere since the 1950s. The Bloomberg Carbon Clock is a real-time estimate of the monthly CO2 level. | |||
* https://www.bloomberg.com/graphics/climate-change-data-green/carbon-clock.html | |||
<big>Annual Greenhouse Gas Emissions / 50.8B metric tons of greenhouse emissions (2017)</big> | |||
* https://www.bloomberg.com/graphics/climate-change-data-green/emissions.html | |||
<big>Global Temperature Change</big> | |||
Last year was the second-hottest on record. The five hottest years have all occurred since 2015. Direct monitoring dates back to 1880. | |||
* https://www.bloomberg.com/graphics/climate-change-data-green/temperature.html | |||
<big>Arctic Sea Ice</big> | |||
The Arctic is heating up much more quickly than the rest of the Earth. Its shrinking ice cap is a consequence of warming — and now an accelerator, too. | |||
* https://www.bloomberg.com/graphics/climate-change-data-green/ice.html | |||
<big>Air Pollution</big> | |||
Tiny particles suspended in the air contribute to millions of deaths a year. They also harm the climate. See which cities within sensor range have the unhealthiest air. | |||
* https://www.bloomberg.com/graphics/climate-change-data-green/air-quality.html | |||
<big>Tree Loss</big> | |||
It’s not just the Amazon rainforest. The quest for land and resources is eliminating the world’s greenest places. | |||
* https://www.bloomberg.com/graphics/climate-change-data-green/trees.html | |||
<big>Real-Time Power Mix</big> | |||
The electricity mix is changing faster than ever as nations embrace solar, wind, geothermal and even nuclear power. | |||
Not carbon-free: Oil Coal Natural gas Thermal Biomass Waste | |||
Carbon-free: Nuclear Solar Geothermal Wind Hydro | |||
* https://www.bloomberg.com/graphics/climate-change-data-green/power-mix.html | |||
<big>Renewable Investment $81.9B</big> | |||
Renewable capacity investment, Q4 2019 | |||
* https://www.bloomberg.com/graphics/climate-change-data-green/investment.html | |||
○ | |||
[[Category:Air Quality]] | |||
[[Category:Air Pollution]] | |||
[[Category:Agriculture]] | |||
[[Category:Alternative Agriculture]] | |||
[[Category:Antarctica]] | |||
[[Category:Anthropocene]] | |||
[[Category:Arctic]] | |||
[[Category:Atmospheric Science]] | |||
[[Category:City Governments]] | |||
[[Category:Climate Change]] | |||
[[Category:Climate Migration]] | |||
[[Category:Climate Policy]] | |||
[[Category:County Governments]] | |||
[[Category:Desertification]] | |||
[[Category:Digital Citizen]] | |||
[[Category:Earth Imaging]] | |||
[[Category:Earth Observations]] | |||
[[Category:Earth360]] | |||
[[Category:Earth Science]] | |||
[[Category:Earth Science from Space]] | |||
[[Category:Earth System Science]] | |||
[[Category:Ecology Studies]] | |||
[[Category:Eco-nomics]] | |||
[[Category:Education]] | |||
[[Category:Energy]] | |||
[[Category:Environmental Laws]] | |||
[[Category:Environmental Protection]] | |||
[[Category:Environmental Security]] | |||
[[Category:Environmental Security, National Security]] | |||
[[Category:ESA]] | |||
[[Category:European Union]] | |||
[[Category:Externalities]] | |||
[[Category:Extinction]] | |||
[[Category:Florida]] | |||
[[Category:Food]] | |||
[[Category:Forests]] | |||
[[Category:Fossil Fuels]] | |||
[[Category:Greenland]] | |||
[[Category:Global Security]] | |||
[[Category:Global Warming]] | |||
[[Category:Green Networking]] | |||
[[Category:Green Best Practices]] | |||
[[Category:Green Politics]] | |||
[[Category:Health]] | |||
[[Category:INDC]] | |||
[[Category:Maps]] | |||
[[Category:Money in Politics]] | |||
[[Category:NASA]] | |||
[[Category:NOAA]] | |||
[[Category:Natural Resources]] | |||
[[Category:Networking]] | |||
[[Category:New Definitions of National Security]] | |||
[[Category:New Economy]] | |||
[[Category:New Space]] | |||
[[Category:Oceans]] | |||
[[Category:Ocean Science]] | |||
[[Category:Online Education]] | |||
[[Category:Planet Citizen]] | |||
[[Category:Planet Citizens]] | |||
[[Category:Planet Citizens, Planet Scientists]] | |||
[[Category:Rainforest]] | |||
[[Category:Renewable Energy]] | |||
[[Category:Resilience]] | |||
[[Category:Sea-level Rise]] | |||
[[Category:Sea-Level Rise & Mitigation]] | |||
[[Category:Soil]] | |||
[[Category:Solar Energy]] | |||
[[Category:Strategic Demands]] | |||
[[Category:Sustainability Policies]] | |||
[[Category:Threat Multiplier]] | |||
[[Category:United Nations]] | |||
[[Category:US]] | |||
[[Category:US Environmental Protection Agency]] | |||
[[Category:Water Quality]] | |||
[[Category:Whole Earth]] | |||
[[Category:Wind Energy]] | |||
[[Category:World Bank]] | |||
[[Category:World Wide Web]] | |||
[[Category:Youth]] | |||
Revision as of 12:13, 9 May 2020
<addthis />
Bloomberg Data Dash:
A Live Climate Scoreboard for the World
Via Bloomberg Green: These are the numbers that matter. A difficult global transition is happening right now, away from fossil fuels, deforestation, greenhouse-gas pollution and melting ice. It can be measured with precision and clarity. The processes described by this data dashboard are occurring on a planetary scale, and yet our progress can be measured this minute, in parts per million, in metric tons, in fractions of a degree. This is Bloomberg Green’s guide to the worldwide goal of slowing and stopping warming temperatures. This is a record of how far we have to go, and a tool to assess how much we can change.
Carbon Clock
Scientists have measured the rising level of carbon dioxide in the atmosphere since the 1950s. The Bloomberg Carbon Clock is a real-time estimate of the monthly CO2 level.
Annual Greenhouse Gas Emissions / 50.8B metric tons of greenhouse emissions (2017)
Global Temperature Change
Last year was the second-hottest on record. The five hottest years have all occurred since 2015. Direct monitoring dates back to 1880.
Arctic Sea Ice
The Arctic is heating up much more quickly than the rest of the Earth. Its shrinking ice cap is a consequence of warming — and now an accelerator, too.
Air Pollution
Tiny particles suspended in the air contribute to millions of deaths a year. They also harm the climate. See which cities within sensor range have the unhealthiest air.
Tree Loss
It’s not just the Amazon rainforest. The quest for land and resources is eliminating the world’s greenest places.
Real-Time Power Mix
The electricity mix is changing faster than ever as nations embrace solar, wind, geothermal and even nuclear power.
Not carbon-free: Oil Coal Natural gas Thermal Biomass Waste
Carbon-free: Nuclear Solar Geothermal Wind Hydro
Renewable Investment $81.9B
Renewable capacity investment, Q4 2019
○
File history
Click on a date/time to view the file as it appeared at that time.
| Date/Time | Thumbnail | Dimensions | User | Comment | |
|---|---|---|---|---|---|
| current | 12:07, 9 May 2020 | 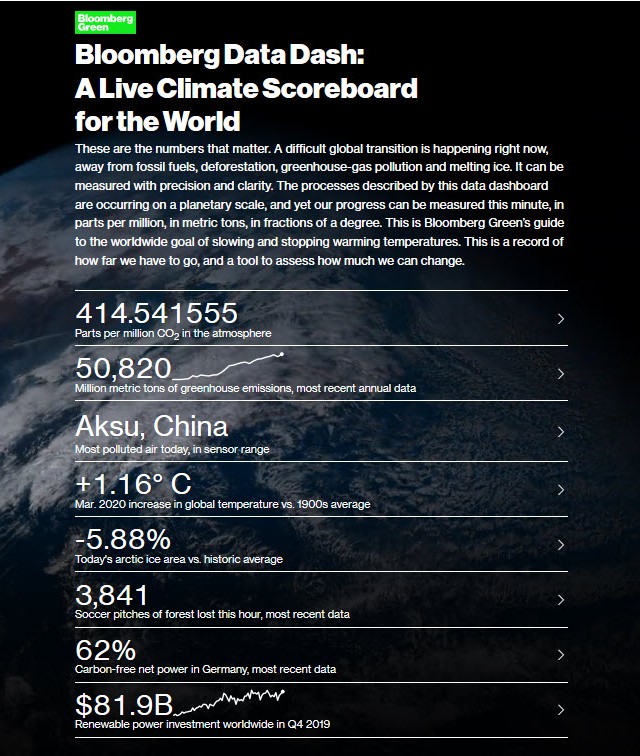 | 640 × 756 (156 KB) | Siterunner (talk | contribs) |
You cannot overwrite this file.
File usage
The following 2 pages use this file:
- Air Quality
- Air Pollution
- Agriculture
- Alternative Agriculture
- Antarctica
- Anthropocene
- Arctic
- Atmospheric Science
- City Governments
- Climate Change
- Climate Migration
- Climate Policy
- County Governments
- Desertification
- Digital Citizen
- Earth Imaging
- Earth Observations
- Earth360
- Earth Science
- Earth Science from Space
- Earth System Science
- Ecology Studies
- Eco-nomics
- Education
- Energy
- Environmental Laws
- Environmental Protection
- Environmental Security
- Environmental Security, National Security
- ESA
- European Union
- Externalities
- Extinction
- Florida
- Food
- Forests
- Fossil Fuels
- Greenland
- Global Security
- Global Warming
- Green Networking
- Green Best Practices
- Green Politics
- Health
- INDC
- Maps
- Money in Politics
- NASA
- NOAA
- Natural Resources
- Networking
- New Definitions of National Security
- New Economy
- New Space
- Oceans
- Ocean Science
- Online Education
- Planet Citizen
- Planet Citizens
- Planet Citizens, Planet Scientists
- Rainforest
- Renewable Energy
- Resilience
- Sea-level Rise
- Sea-Level Rise & Mitigation
- Soil
- Solar Energy
- Strategic Demands
- Sustainability Policies
- Threat Multiplier
- United Nations
- US
- US Environmental Protection Agency
- Water Quality
- Whole Earth
- Wind Energy
- World Bank
- World Wide Web
- Youth