Category:Oceans: Difference between revisions
Siterunner (talk | contribs) No edit summary |
Siterunner (talk | contribs) No edit summary |
||
| Line 148: | Line 148: | ||
http://www.greenpolicy360.net/w/Anthropocene | http://www.greenpolicy360.net/w/Anthropocene | ||
○ | |||
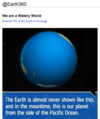
'''The World Is Blue''' | |||
[[File:The World Is Blue.jpg]] | [[File:The World Is Blue.jpg]] | ||
Revision as of 16:07, 1 September 2015

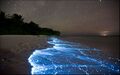
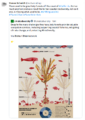
Ocean's hidden world of plankton revealed in 'enormous database' / May 2015 -- http://www.bbc.com/news/science-environment-32831814
__________________________________________________________________________________________________________________
"Green" issues make headlines these days, but many seem unaware that without the "blue" there could be no green, no life on Earth and therefore none of the other things that humans value. Water--the blue--is the key to life."
-- Sylvia A. Earle, "The World Is Blue: How Our Fate and the the Ocean's Are One", National Geographic Publications, 2009
○ ○ ○ ○ ○ ○ ○ ○ ○ ○ ○ ○ ○ ○ ○ ○ ○ ○ ○ ○ ○ ○ ○ ○ ○ ○ ○ ○ ○ ○
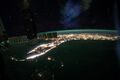
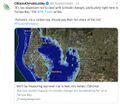
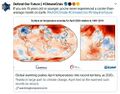
August 2015/NASA: "What's up with sea-level rise?"
Data from NASA coming i/o from JPL US/Euro mission control
http://www.nasa.gov/goddard/risingseas --- http://svs.gsfc.nasa.gov/cgi-bin/details.cgi?aid=11978 --- https://sealevel.jpl.nasa.gov/ --- http://www.washingtonpost.com/news/energy-environment/wp/2015/08/26/the-troubling-reasons-why-nasa-is-so-focused-on-studying-on-sea-level-rise/ --- https://en.wikipedia.org/wiki/Ocean_Surface_Topography_Mission
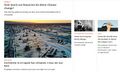
Why NASA’s so worried that Greenland’s melting could speed up
○ ○ ○ ○ ○ ○ ○ ○ ○ ○ ○ ○ ○ ○ ○ ○ ○ ○ ○ ○ ○ ○ ○ ○ ○ ○ ○ ○ ○ ○ ○ ○ ○ ○ ○ ○ ○
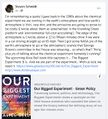
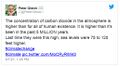
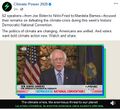
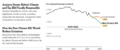
Global trends show seabird populations dropped 70 per cent since 1950s
“Seabirds are particularly good indicators of the health of marine ecosystems,” said Paleczny. ”When we see this magnitude of seabird decline, we can see there is something wrong with marine ecosystems. It gives us an idea of the overall impact we’re having.”
The dramatic decline is caused by a variety of factors including overfishing of the fish seabirds rely on for food, birds getting tangled in fishing gear, plastic and oil pollution, introduction of non-native predators to seabird colonies, destruction and changes to seabird habitat, and environmental and ecological changes caused by climate change.
Seabirds tend to travel the world’s oceans foraging for food over their long lifetimes, and return to the same colonies to breed. Colony population numbers provide information to scientists about the health of the oceans the birds call home.
http://journals.plos.org/plosone/article?id=10.1371/journal.pone.0129342
_________________________________
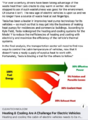
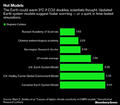
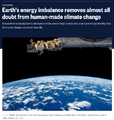
Where Is the Heat Going?
http://www.businessinsider.com/ocean-is-absorbing-heat-from-climate-change-2015-8
Here's where over 90% of the extra heat from global warming is going and the billions of dollars it's costing us
Via Business Insider / August 2015
http://www.businessinsider.com/future-marine-life-climate-change-2015-7
_____________________________________________________________________________________
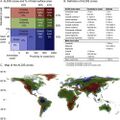
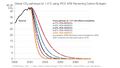
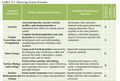
Contrasting futures for ocean and society from different anthropogenic CO2 emissions scenarios
via Science / July 2015
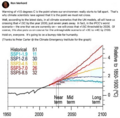
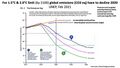
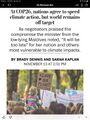
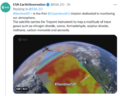
Although the ocean moderates anthropogenic climate change, this has great impacts on its fundamental physics and chemistry, with important consequences for ecosystems and people. Yet, despite the ocean’s critical role in regulating climate—and providing food security and livelihoods for millions of people—international climate negotiations have only minimally considered impacts on the ocean. Here, we evaluate changes to the ocean and its ecosystems, as well as to the goods and services they provide, under two contrasting CO2 scenarios: the current high-emissions trajectory (Representative Concentration Pathway 8.5, RCP8.5) and a stringent emissions scenario (RCP2.6) consistent with the Copenhagen Accord of keeping mean global temperature increase below 2°C in the 21st century. To do this, we draw on the consensus science in the latest assessment report of the Intergovernmental Panel on Climate Change and papers published since the assessment.
ADVANCES
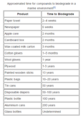
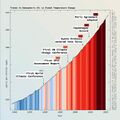
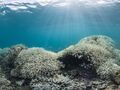
Warming and acidification of surface ocean waters will increase proportionately with cumulative CO2 emissions (see figure). Warm-water corals have already been affected, as have mid-latitude seagrass, high-latitude pteropods and krill, mid-latitude bivalves, and fin fishes. Even under the stringent emissions scenario (RCP2.6), warm-water corals and mid-latitude bivalves will be at high risk by 2100. Under our current rate of emissions, most marine organisms evaluated will have very high risk of impacts by 2100 and many by 2050. These results—derived from experiments, field observations, and modeling—are consistent with evidence from high-CO2 periods in the paleorecord.
Impacts to the ocean’s ecosystem services follow a parallel trajectory. Services such as coastal protection and capture fisheries are already affected by ocean warming and acidification. The risks of impacts to these services increase with continued emissions: They are predicted to remain moderate for the next 85 years for most services under stringent emission reductions, but the business-as-usual scenario (RCP8.5) would put all ecosystem services we considered at high or very high risk over the same time frame. These impacts will be cumulative or synergistic with other human impacts, such as overexploitation of living resources, habitat destruction, and pollution. Fin fisheries at low latitudes, which are a key source of protein and income for millions of people, will be at high risk.
OUTLOOK
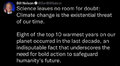
Four key messages emerge. First, the ocean strongly influences the climate system and provides important services to humans. Second, impacts on key marine and coastal organisms, ecosystems, and services are already detectable, and several will face high risk of impacts well before 2100, even under the low-emissions scenario (RCP2.6). These impacts will occur across all latitudes, making this a global concern beyond the north/south divide. Third, immediate and substantial reduction of CO2 emissions is required to prevent the massive and mostly irreversible impacts on ocean ecosystems and their services that are projected with emissions greater than those in RCP2.6. Limiting emissions to this level is necessary to meet stated objectives of the United Nations Framework Convention on Climate Change; a substantially different ocean would result from any less-stringent emissions scenario. Fourth, as atmospheric CO2 increases, protection, adaptation, and repair options for the ocean become fewer and less effective.
The ocean provides compelling arguments for rapid reductions in CO2 emissions and eventually atmospheric CO2 drawdown...
○ ○ ○ ○ ○ ○ ○ ○ ○ ○ ○ ○ ○ ○ ○ ○ ○ ○ ○ ○ ○ ○ ○ ○ ○ ○ ○ ○ ○ ○ ○ ○ ○ ○ ○ ○ ○ ○ ○ ○ ○ ○ ○ ○ ○ ○ ○ ○ ○ ○ ○ ○ ○ ○ ○ ○ ○ ○ ○ ○ ○ ○ ○ ○
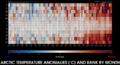
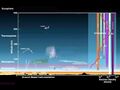
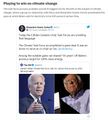
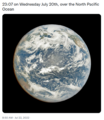
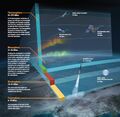
July 9, 2015
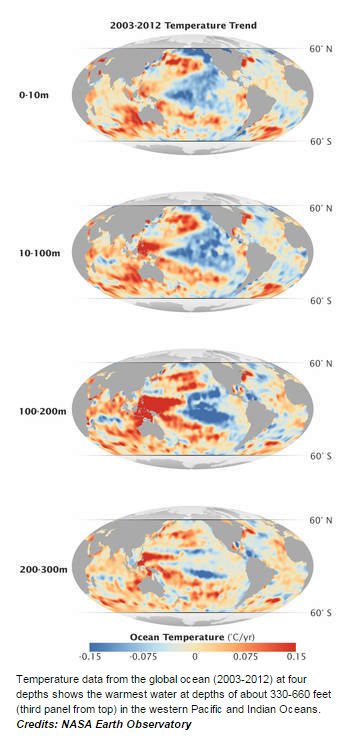
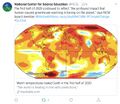
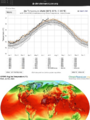
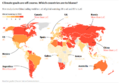
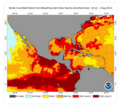
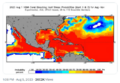
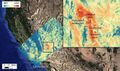
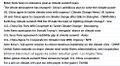
NASA Study Finds Indian, Pacific Oceans Temporarily Hide Global Warming
-- The new study used ocean temperature measurements from a global array of 3,500 Argo floats and other ocean sensors.
-- Temperature data from the global ocean (2003-2012) at four depths
-- Via NASA Earth Observatory http://www.nasa.gov/earth
A new NASA study of ocean temperature measurements shows in recent years extra heat from greenhouse gases has been trapped in the waters of the Pacific and Indian oceans. Researchers say this shifting pattern of ocean heat accounts for the slowdown in the global surface temperature trend observed during the past decade. Researchers Veronica Nieves, Josh Willis and Bill Patzert of NASA’s Jet Propulsion Laboratory (JPL), Pasadena, California, found a specific layer of the Indian and Pacific oceans between 300 and 1,000 feet (100 and 300 meters) below the surface has been accumulating more heat than previously recognized. They also found the movement of warm water has affected surface temperatures. The result was published Thursday in the journal Science.
During the 20th century, as greenhouse gas concentrations increased and trapped more heat energy on Earth, global surface temperatures also increased. However, in the 21st century, this pattern seemed to change temporarily.
"Greenhouse gases continued to trap extra heat, but for about 10 years starting in the early 2000s, global average surface temperature stopped climbing, and even cooled a bit," said Willis.
In the study, researchers analyzed direct ocean temperature measurements, including observations from a global network of about 3,500 ocean temperature probes known as the Argo array. These measurements show temperatures below the surface have been increasing.
The Pacific Ocean is the primary source of the subsurface warm water found in the study, though some of that water now has been pushed to the Indian Ocean. Since 2003, unusually strong trade winds and other climatic features have been piling up warm water in the upper 1,000 feet of the western Pacific, pinning it against Asia and Australia.
"The western Pacific got so warm that some of the warm water is leaking into the Indian Ocean through the Indonesian archipelago," said Nieves, the lead author of the study.
The movement of the warm Pacific water westward pulled heat away from the surface waters of the central and eastern Pacific, which resulted in unusually cool surface temperatures during the last decade. Because the air temperature over the ocean is closely related to the ocean temperature, this provides a plausible explanation for the global cooling trend in surface temperature.
Cooler surface temperatures also are related to a long-lived climatic pattern called the Pacific Decadal Oscillation, which moves in a 20 to 30 year cycle. It has been in a cool phase during the entire time surface temperatures showed cooling, bringing cooler-than-normal water to the eastern Pacific and warmer water to the western side. There currently are signs the pattern may be changing to the opposite phase, with observations showing warmer-than-usual water in the eastern Pacific.
"Given the fact the Pacific Decadal Oscillation seems to be shifting to a warm phase, ocean heating in the Pacific will definitely drive a major surge in global surface warming," Nieves said.
Previous attempts to explain the global surface temperature cooling trend have relied more heavily on climate model results or a combination of modeling and observations, which may be better at simulating long-term impacts over many decades and centuries. This study relied on observations, which are better for showing shorter-term changes over 10 to 20 years. In shorter time spans, natural variations such as the recent slowdown in global surface temperature trends can have larger regional impacts on climate than human-caused warming.
Pauses of a decade or more in Earth's average surface temperature warming have happened before in modern times, with one occurring between the mid-1940s and late 1970s.
"In the long term, there is robust evidence of unabated global warming," Nieves said.
NASA uses the vantage point of space to increase our understanding of our home planet, improve lives and safeguard our future. NASA develops new ways to observe and study Earth's interconnected natural systems with long-term data records.
The agency freely shares this unique knowledge and works with institutions around the world to gain new insights into how our planet is changing.
__________________
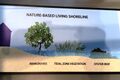
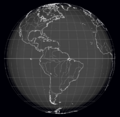
Sea-level Rise

○ ○ ○ ○ ○ ○ ○ ○ ○ ○ ○ ○ ○ ○ ○ ○ ○ ○ ○ ○ ○ ○ ○ ○ ○ ○ ○ ○ ○ ○ ○ ○
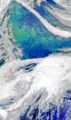
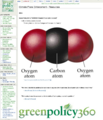
The ocean and the atmosphere exchange massive amounts of CO2
An anthropogenic flux has been superimposed on the natural flux
http://bit.ly/oceans_acidification
https://en.wikipedia.org/wiki/Ocean_acidification
○ ○ ○ ○
The Darkening Sea by Elizabeth Kolbert
http://www.newyorker.com/magazine/2006/11/20/the-darkening-sea
○ ○ ○ ○
http://www.greenpolicy360.net/w/Anthropocene
○
The World Is Blue

Subcategories
This category has the following 18 subcategories, out of 18 total.
A
B
E
F
G
O
P
S
T
Pages in category "Oceans"
The following 84 pages are in this category, out of 84 total.
C
E
- Earth and Space, Politics
- Earth from NASA
- Earth Imaging-New Space
- Earth Right Now
- Earth Science
- Earth Science Research from Space
- Earth Science Vital Signs
- Ecolivia
- Environmental agreements
- Environmental movement
- Environmental protection
- ESA Living Planet Announcement - May 2022
- European Union Green Deal - Fit for 55
- Extinction
G
- George E. Brown Jr
- Glasgow Climate Summit - Pledges, Promises, Declarations - What's Next Up
- Global Fishing Watch
- Google Earth
- Google Earth Timelapse
- GP360 NewPages
- Green Stories of the Day
- Green Stories of the Day - GreenPolicy360 Archive
- GreenPolicy360 Archive Highlights 2013
- GreenPolicy360 Archive Highlights 2014
- GreenPolicy360 Archive Highlights 2015
- GreenPolicy360 Archive Highlights 2016
- GreenPolicy360 Archive Highlights 2017
- GreenPolicy360 Archive Highlights 2018
- GreenPolicy360 Archive Highlights 2019
- GreenPolicy360 Archive Highlights 2020
- GreenPolicy360 Archive Highlights 2023
- GreenPolicy360 Highlights
L
P
T
V
Media in category "Oceans"
The following 200 files are in this category, out of 639 total.
(previous page) (next page) 'Most beautiful from space' the Bahamas by Scott Kelly Apr 26, 2015.png 800 × 511; 767 KB
 1977 from the Office of Science and Technology Policy.jpg 661 × 711; 177 KB
 2020 record temperatures.png 800 × 502; 358 KB
 3-15-2016 12-29-07 PM.png 538 × 701; 201 KB
 5 19 14 andrew antarcticaelevationchanges-640x547.jpg 640 × 547; 59 KB
 7-20-2020 GreenPolicy360 RT No.2.jpg 591 × 510; 125 KB
 A Fierce Green Fire.jpg 208 × 314; 13 KB
 A scorching year, what about the 360 warming data.jpg 600 × 706; 106 KB
 A View of the Earth and Moon from Mars.jpg 720 × 890; 3 KB
 About Baselines and Change.png 592 × 312; 33 KB
 About website of The Invading Sea.png 800 × 343; 126 KB
 Above Florida green.jpg 1,091 × 726; 171 KB
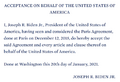 Acceptance on behalf of the United States of America.png 448 × 306; 62 KB
 Act now for a livable future.png 501 × 275; 272 KB
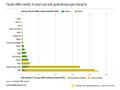 Ag production and GHG emissions.jpg 680 × 510; 33 KB
 Against the Tide - Cover - by Cornelia Dean.jpg 308 × 475; 57 KB
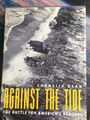 Against the Tide by Cornelia Dean.jpg 600 × 800; 265 KB
 Against-The-Tide.jpg 268 × 400; 40 KB
 Aldis zone blog.jpg 500 × 498; 67 KB
 Algae release -nikon-small-world-competition-2017-winners.jpg 640 × 576; 89 KB
 All species day with homo sapien in Santa Fe .jpg 640 × 369; 98 KB
 Amherst-Bottle.gif 364 × 360; 35 KB
 Antarctic sea ice 1989-2023 chart as of July2023.png 640 × 433; 294 KB
 AOC re climate task force - july 8 2020.jpg 585 × 203; 38 KB
 April 28, 2016.png 586 × 415; 159 KB
 Arctic - Kolbert - 2023.png 553 × 476; 274 KB
 Arctic Melt - 1950-2020.png 640 × 349; 287 KB
 Arctic sea ice watch 25 yrs of ice cover change.png 697 × 386; 314 KB
 Arctic Siberia Heatwave - Again - June 2021.jpg 640 × 360; 83 KB
 Arctic-Siberia-6-20-2020.jpg 478 × 644; 148 KB
 AskNatureAvatar s.png 200 × 200; 14 KB
 At st peters endangered species.png 717 × 431; 242 KB
 Atmosphere Science.jpg 800 × 600; 45 KB
 Atmospheric Experiment of Humanity.jpg 519 × 574; 201 KB
 Audubon study ms.png 529 × 434; 437 KB
 Banking - finance - climate - Mann-1.jpg 452 × 640; 162 KB
 Banking - finance - climate - Mann-2.jpg 452 × 640; 164 KB
 BantheBag California-OutinFront.png 519 × 715; 449 KB
 Barrier island hubris 6-29-2021.jpg 490 × 635; 111 KB
 Battle for Democracy.jpg 640 × 123; 24 KB
 Ben Lecomte enters the Pacific.jpg 780 × 438; 64 KB
 Bernie Sanders, Senate 2.PNG 800 × 517; 379 KB
 Bernie Sanders, Senate Aug 3.PNG 800 × 518; 388 KB
 Beyond ludicrous politics in Florida March2015.png 761 × 251; 30 KB
 Biden - clean energy ambitions.JPG 640 × 334; 31 KB
 Biden introduces leadership team - Nov 24 2020.jpg 800 × 644; 173 KB
 Biden re Earth Day 2023.png 640 × 400; 155 KB
 Biden selects Kerry as special climate envoy.jpg 592 × 505; 87 KB
 Biden urged to act - Oct 18 2021 - The Guardian.png 663 × 600; 497 KB
 Biden's assembled an all-star climate team 4-21-2021.jpg 682 × 732; 309 KB
 Biden-Sanders Unity Task Force on Climate.jpg 701 × 780; 139 KB
 Big Oil Rocked by News May 27 2021.jpg 639 × 600; 84 KB
 Big Wobble 2020.jpg 507 × 342; 79 KB
 Bill Nelson on Global Temp Rise and Climate Change.png 640 × 353; 100 KB
 Bill Nye The Planet's on Fire.jpg 800 × 675; 106 KB
 Biodegradable products--need for smarter product packaging.png 407 × 585; 34 KB
 Bioluminescent phytoplankton Maldives.jpg 842 × 526; 76 KB
 Bloomberg Carbon Clock 10-26-2021 8-47-05 AM EST.png 800 × 195; 356 KB
 Bloomberg Live Climate Data Dashboard.jpg 640 × 756; 156 KB
 Blue Mind.jpg 475 × 350; 25 KB
 Blue Planet II.png 800 × 425; 674 KB
 Blue-Green & Planet Citizens, Planet Scientists.png 549 × 844; 94 KB
 Blue-green phyto swirling 2015.png 357 × 605; 409 KB
 Blueoceanwaves.png 983 × 579; 857 KB
 Breakpoint - Reckoning with America's Environmental Crisis.jpg 329 × 500; 49 KB
 Burst of climate denial as Trump presidency ends.jpg 632 × 604; 92 KB
 California's kelp forests and coastal biodiversity diminished.png 532 × 754; 307 KB
 Car heating and cooling.png 465 × 635; 261 KB
 Carbon Brief - Greenhouse gas levels 2021.png 640 × 436; 292 KB
 Carl Sagan at the Emerging Issues Forum - 1990.png 360 × 460; 192 KB
 Carl Sagan at the Emerging Issues Forum.png 747 × 600; 600 KB
 Carl Sagan, 1985.PNG 480 × 566; 331 KB
 Carl Sagan, the atmosphere unifies and connects all of our world.png 360 × 390; 229 KB
 CFSV2 world temp July 3, 2023.png 600 × 800; 513 KB
 Challenge of Acting for the Commons.png 700 × 548; 175 KB
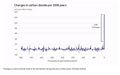 Changes in carbon dioxide per 1000 years - via Climate Central.jpg 682 × 424; 34 KB
 Chasing Coral.jpg 800 × 437; 65 KB
 Citizens Climate Lobby - Save Our Future Act 2021.jpg 518 × 262; 77 KB
 Citizens Climate Lobby - Tampa Bay.jpg 586 × 515; 125 KB
 Climate Action 25th conf in Madrid.jpg 680 × 510; 22 KB
 Climate activist - Steven Schmidt - 1978 on.png 600 × 480; 174 KB
 Climate Books - 2020.jpg 800 × 450; 69 KB
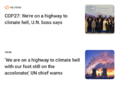
 Climate Change COP27 - Nov 11 2022 US Representatives.jpg 712 × 444; 54 KB
 Climate Change COP27 - Nov 11 Kathy Castor.jpg 712 × 710; 77 KB
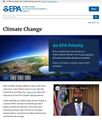 Climate Change US EPA.jpg 600 × 703; 95 KB
 Climate Conferences 1979-2020.jpg 768 × 768; 121 KB
 Climate Crisis - Emily Atkin Heated No. 1.jpg 537 × 453; 61 KB
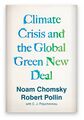 Climate Crisis and the Global Green New Deal.jpg 293 × 418; 33 KB
 Climate debate.jpg 493 × 580; 129 KB
 Climate Desk.jpg 390 × 226; 21 KB
 Climate diplomacy is failing - June 2020.jpg 592 × 440; 71 KB
 Climate Emergency Institute - Oct 2022.png 610 × 600; 274 KB
 Climate Emergency Institute -- 2021.jpg 800 × 450; 55 KB
 Climate emergency.jpg 800 × 450; 69 KB
 Climate Goals off course - 2018.png 800 × 556; 214 KB
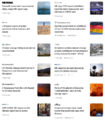
 Climate Headline News around the World - July 2023.jpg 600 × 704; 151 KB
 Climate Models.png 639 × 558; 123 KB
 Climate News - Oct 28 2022.jpg 626 × 600; 88 KB
 Climate News - United Nations Report - Feb 2022.png 768 × 878; 539 KB
 Climate News Dec 4 2023 in Dubai.png 800 × 1,037; 649 KB
 Climate News Florida.jpg 600 × 697; 113 KB
 Climate Plans Enforcement - Resources - GreenPolicy.png 768 × 897; 686 KB
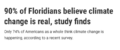 Climate poll - Florida.png 640 × 267; 36 KB
 Climate strike - Week 171.png 739 × 600; 834 KB
 Climate Strike Around the World - Sep20,2019.jpg 700 × 830; 119 KB
 Climate Summit - Leonardo DiCaprio.png 600 × 663; 521 KB
 Climate Summit live updates - Nov 2 2021.png 751 × 600; 420 KB
 Climate Summit planned-1.jpg 800 × 301; 53 KB
 Climate Summit planned-2.jpg 800 × 187; 31 KB
 Climate Summit planned-3.jpg 800 × 278; 44 KB
 Climate Summit planned-4.jpg 800 × 241; 41 KB
 ClimateNews 360.jpg 172 × 172; 9 KB
 ClimateNewsFlorida.jpg 448 × 191; 36 KB
 CO2 at Mauna Loa data - June 02, 2020 - 417.90 ppm.jpg 640 × 566; 66 KB
 CO2 cumulative emissions 1850 - 2021 - countries.jpg 640 × 462; 211 KB
 CO2 emissions-around-the-world.png 800 × 595; 123 KB
 CO2 global pathways via IPCC AR6 - how will we respond.jpg 800 × 450; 57 KB
 CO2 higher than in the past 5 million yrs.jpg 514 × 285; 62 KB
 Commons-concepts permanent culture now s.png 448 × 211; 75 KB
 Commons-concepts permanent culture now.png 830 × 391; 39 KB
 Congressman george.e.brown.gif 235 × 305; 41 KB
 Connect with Nature.png 405 × 280; 17 KB
 COP26 Climate Summit concludes.jpg 600 × 800; 160 KB
 COP26 concludes - 2.png 648 × 467; 177 KB
 COP26 concludes - 3.png 648 × 713; 416 KB
 COP26 concludes.png 648 × 528; 329 KB
 COP26 in GLASGOW - 31 OCT-12 NOV 2021.jpg 800 × 264; 51 KB
 COP27 'opening speech'.png 640 × 460; 160 KB
 COP28 News - Dec 13 2023.png 800 × 898; 410 KB
 CopernicusEU - Sentinel5P Atmosphere Monitoring Mission - 2.jpg 795 × 1,477; 654 KB
 CopernicusEU - Sentinel5P Atmosphere Monitoring Mission.png 583 × 465; 222 KB
 Coral bleaching - August 2023.png 488 × 430; 261 KB
 Coral bleaching - NOAA - August 2023.png 488 × 338; 201 KB
 Coral bleaching Great Barrier Reef 2016.jpeg 630 × 472; 91 KB
 Coral growing-Mott Lab,Florida.jpg 800 × 382; 114 KB
 Coral reef rejuvenation-montage.png 569 × 236; 318 KB
 Covering Climate Now.jpg 493 × 498; 67 KB
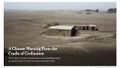 Cradle of Civilization - and climate change.jpg 640 × 360; 70 KB
 Crystal Serenity cruises 2016.png 407 × 754; 274 KB
 Crystal Serenity.png 800 × 254; 468 KB
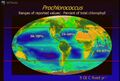 Cyanobacteria Prochlorococcus worldmapping MIT.jpg 473 × 321; 60 KB
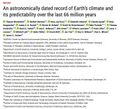 Dated record of Earths climate - Science Report Sept 10 2020.jpg 735 × 669; 192 KB
 David-brower-environmental-movement-cover.jpg 530 × 800; 89 KB
 Death Valley ... the heat, what its like.jpg 640 × 381; 62 KB
 Defend Our Future 6-1-2020.jpg 585 × 458; 103 KB
 Democratic Climate Plan-Introduced June 2020.jpg 528 × 561; 117 KB
 Democratic National Convention-62 climate speakers.jpg 443 × 407; 57 KB
 Democratic Party Climate Bill - Aug 2022.png 640 × 269; 70 KB
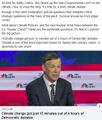
 Democratic Party pres candidates debate in Miami-June 2019.jpg 800 × 534; 124 KB
 Diane Walder in Miami Beach.jpg 775 × 787; 147 KB
 Discovery Center, St Pete Pier, Living Shorelines.jpg 800 × 530; 118 KB
 DJT - US message to world.jpg 800 × 266; 45 KB
 Don't Look Up ....jpg 430 × 543; 172 KB
 Don't Look Up.jpg 800 × 450; 104 KB
 Dove1 image.jpg 420 × 308; 26 KB
 DSCOVR EPIC - July 20 2022.png 532 × 612; 315 KB
 Earth - Pacific Ocean.png 504 × 602; 233 KB
 Earth AI - Feb 2022.png 482 × 480; 192 KB
 Earth and Space, Politics.png 796 × 765; 349 KB
 Earth Breathing.jpg 800 × 450; 117 KB
 Earth Day 2021 - Climate Summit News-1.jpg 491 × 270; 127 KB
 Earth Day 50 years on.jpg 480 × 548; 107 KB
 Earth Day Flag.png 400 × 267; 69 KB
 Earth Information Center - 2022 Graphic NASA.png 800 × 981; 868 KB
 Earth Information Center from NASA.jpg 800 × 577; 94 KB
 Earth mapped.png 800 × 783; 254 KB
 Earth Observing System - fleet of satellites.png 740 × 576; 557 KB
 Earth POV from the ISS Cupola-m.jpg 800 × 480; 71 KB
 Earth Research Findings 2015 1.png 1,088 × 686; 1.49 MB
 Earth Research Findings 2015 2.png 1,088 × 241; 512 KB
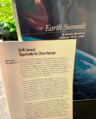 Earth Summit 1992-s.png 336 × 418; 283 KB
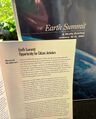 Earth Summit 1992.jpg 600 × 746; 171 KB
 Earth System Observatory-1.jpg 580 × 833; 129 KB
 Earth System Observatory-2.jpg 580 × 831; 69 KB
 Earth trapping unprecedented amount of heat - NASA.jpg 468 × 373; 56 KB
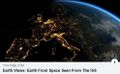 Earth Viewing from the International Space Station.jpg 496 × 307; 45 KB
 EARTH-ISLAND-LOGO.png 314 × 148; 12 KB
 Earth-science.png 265 × 83; 13 KB
 Earth-upper-atmosphere-NASA.jpg 800 × 781; 327 KB
 EarthDecadel Priorities-2018.jpg 779 × 529; 85 KB
 EarthScience Missions via the EOS - 2022.png 800 × 219; 139 KB
 Economist.com global capital snapshot as of July 2020.jpg 800 × 477; 119 KB
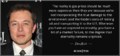 Elon Musk quote - gas externality price.png 680 × 320; 199 KB
 Energy Charter Treaty.jpg 512 × 480; 74 KB
 Energy Imbalance, Climate Change - Aug 1 2021.png 640 × 672; 394 KB
 Env policy laws US 'the beginning' of env era.jpg 370 × 345; 65 KB
 Environmental laws in US - Supreme Court votes soon.png 800 × 414; 334 KB
 Environmental Studies-Documerica.png 688 × 963; 522 KB
 EnvironmentalSecurity ThinBlue.png 223 × 248; 94 KB
 EnvirSecurity.png 558 × 166; 155 KB


