File:Unified sea level rise - Southeast Florida.jpg: Difference between revisions
Siterunner (talk | contribs) No edit summary |
Siterunner (talk | contribs) No edit summary |
||
| Line 1: | Line 1: | ||
<big>'''''Unified sea level rise - Southeast Florida'''''</big> | |||
* http://southeastfloridaclimatecompact.org/wp-content/uploads/2015/10/2015-Compact-Unified-Sea-Level-Rise-Projection.pdf | |||
''The Southeast Florida Regional Climate Change Compact reconvened the Sea Level Rise Work Group for the purpose of updating the unified regional projection based on global projections, guidance documents and scientific literature released since the original regional projection in 2011(Compact, 2011). The objective of the unified sea level rise projection for the Southeast Florida region remains consistent that the projection is for use by the Climate Compact Counties and partners for planning purposes to aid in understanding of potential vulnerabilities and to provide a basis for developing risk informed adaptation strategies for the region.For the 2015 update, the starting point for all sea level rise projections has been shifted from 2010 to 1992. This allows for direct use of local tide station information to convert projections into local water surface elevations for flood vulnerability studies,and is consistent withcurrent guidance from the U.S. Army Corps of Engineers(USACE) and the National Oceanographic and Atmospheric Agency (NOAA). The Unified Sea Level Rise projection for Southeast Florida has also been extended to 2100 in recognition of the need for longer range guidance for major infrastructure and other long term investments now being planned. In the short term, sea level rise is projected to be 6 to 10 inches by 2030 and 14 to 26inches by 2060 (above the 1992 mean sea level). In the long term, sea level rise is projected to be 31 to 61inchesby 2100.For critical infrastructure projects with design lives in excess of 50 years, use of the upper curve is recommended with planning values of 34 inches in 2060 and 81 inches in 2100.The National Aeronautics and Space Administration Jet Propulsion Laboratory (2015)has reported the average global sea level has risen almost 3 inches between 1992 and 2015 based on satellite measurements. Sea level rise in South Florida has been of similar magnitude over the same period (NOAA, 2015) but is anticipated to outpace the global average due to ongoing variations in the Florida Currents and Gulf Stream.Projected sea level rise, especially by2060 and beyond,has a significant range of variation as a result of uncertainty in future greenhouse gas emissions and their geophysical effects, the incomplete quantitative understanding of all geophysical processes that might affect the rate of sea level rise in climate models and the limitations of current climate models to predict the future. As such, the Work Group recommends that the unified sea level rise projection include three curves, in descending order,the NOAA High Curve, the USACE High Curve and a curve corresponding to the median of the IPCC AR5 RCP8.5 scenario, with specific guidance as to how and when they should be used in planning. This guidance document describes the recommended application of the projection as it relates to both high and low risk projects and short and long-term planning efforts. Also, the Work Group recommends that this guidance be updated every five to seven years because of the ongoing advances in scientific knowledge related to global climate change and potential impacts.'' | |||
○ | |||
[[Category:Sea-Level Rise & Mitigation]] | |||
[[Category:Florida]] | |||
[[Category:US]] | |||
[[Category:Anthropocene]] | |||
[[Category:Aquifers]] | |||
[[Category:Atmospheric Science]] | |||
[[Category:Climate Change]] | |||
[[Category:Climate Policy]] | |||
[[Category:Cryosphere]] | |||
[[Category:Divestment from Fossil Fuels]] | |||
[[Category:Earth]] | |||
[[Category:Earth360]] | |||
[[Category:Earth Imaging]] | |||
[[Category:Earth Observations]] | |||
[[Category:Earth Science]] | |||
[[Category:Earth Science from Space]] | |||
[[Category:Eco-nomics]] | |||
[[Category:Ecology Studies]] | |||
[[Category:Environmental Full-cost Accounting]] | |||
[[Category:Environmental Protection]] | |||
[[Category:Environmental Security]] | |||
[[Category:Environmental Security, National Security]] | |||
[[Category:ESA]] | |||
[[Category:Global Security]] | |||
[[Category:Green Politics]] | |||
[[Category:NASA]] | |||
[[Category:New Definitions of National Security]] | |||
[[Category:NOAA]] | |||
[[Category:Ocean Ecosystem]] | |||
[[Category:Oceans]] | |||
[[Category:Ocean Science]] | |||
[[Category:Planet Citizen]] | |||
[[Category:Planet Scientist]] | |||
[[Category:Planet Citizens, Planet Scientists]] | |||
[[Category:Renewable Energy]] | |||
[[Category:Resilience]] | |||
[[Category:Sea-level Rise]] | |||
[[Category:Solar Energy]] | |||
[[Category:Strategic Demands]] | |||
[[Category:Sustainability]] | |||
[[Category:Sustainability Policies]] | |||
[[Category:US Environmental Protection Agency]] | |||
[[Category:Whole Earth]] | |||
Latest revision as of 17:36, 29 March 2019
Unified sea level rise - Southeast Florida
The Southeast Florida Regional Climate Change Compact reconvened the Sea Level Rise Work Group for the purpose of updating the unified regional projection based on global projections, guidance documents and scientific literature released since the original regional projection in 2011(Compact, 2011). The objective of the unified sea level rise projection for the Southeast Florida region remains consistent that the projection is for use by the Climate Compact Counties and partners for planning purposes to aid in understanding of potential vulnerabilities and to provide a basis for developing risk informed adaptation strategies for the region.For the 2015 update, the starting point for all sea level rise projections has been shifted from 2010 to 1992. This allows for direct use of local tide station information to convert projections into local water surface elevations for flood vulnerability studies,and is consistent withcurrent guidance from the U.S. Army Corps of Engineers(USACE) and the National Oceanographic and Atmospheric Agency (NOAA). The Unified Sea Level Rise projection for Southeast Florida has also been extended to 2100 in recognition of the need for longer range guidance for major infrastructure and other long term investments now being planned. In the short term, sea level rise is projected to be 6 to 10 inches by 2030 and 14 to 26inches by 2060 (above the 1992 mean sea level). In the long term, sea level rise is projected to be 31 to 61inchesby 2100.For critical infrastructure projects with design lives in excess of 50 years, use of the upper curve is recommended with planning values of 34 inches in 2060 and 81 inches in 2100.The National Aeronautics and Space Administration Jet Propulsion Laboratory (2015)has reported the average global sea level has risen almost 3 inches between 1992 and 2015 based on satellite measurements. Sea level rise in South Florida has been of similar magnitude over the same period (NOAA, 2015) but is anticipated to outpace the global average due to ongoing variations in the Florida Currents and Gulf Stream.Projected sea level rise, especially by2060 and beyond,has a significant range of variation as a result of uncertainty in future greenhouse gas emissions and their geophysical effects, the incomplete quantitative understanding of all geophysical processes that might affect the rate of sea level rise in climate models and the limitations of current climate models to predict the future. As such, the Work Group recommends that the unified sea level rise projection include three curves, in descending order,the NOAA High Curve, the USACE High Curve and a curve corresponding to the median of the IPCC AR5 RCP8.5 scenario, with specific guidance as to how and when they should be used in planning. This guidance document describes the recommended application of the projection as it relates to both high and low risk projects and short and long-term planning efforts. Also, the Work Group recommends that this guidance be updated every five to seven years because of the ongoing advances in scientific knowledge related to global climate change and potential impacts.
○
File history
Click on a date/time to view the file as it appeared at that time.
| Date/Time | Thumbnail | Dimensions | User | Comment | |
|---|---|---|---|---|---|
| current | 17:31, 29 March 2019 | 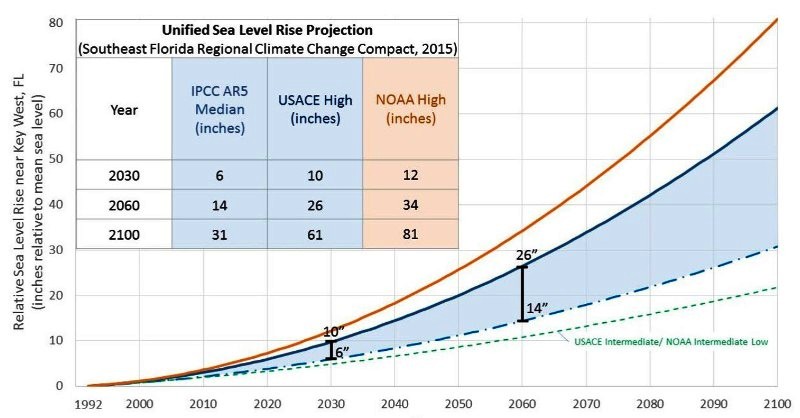 | 800 × 418 (70 KB) | Siterunner (talk | contribs) |
You cannot overwrite this file.
File usage
The following 2 pages use this file:
- Sea-Level Rise & Mitigation
- Florida
- US
- Anthropocene
- Aquifers
- Atmospheric Science
- Climate Change
- Climate Policy
- Cryosphere
- Divestment from Fossil Fuels
- Earth
- Earth360
- Earth Imaging
- Earth Observations
- Earth Science
- Earth Science from Space
- Eco-nomics
- Ecology Studies
- Environmental Full-cost Accounting
- Environmental Protection
- Environmental Security
- Environmental Security, National Security
- ESA
- Global Security
- Green Politics
- NASA
- New Definitions of National Security
- NOAA
- Ocean Ecosystem
- Oceans
- Ocean Science
- Planet Citizen
- Planet Scientist
- Planet Citizens, Planet Scientists
- Renewable Energy
- Resilience
- Sea-level Rise
- Solar Energy
- Strategic Demands
- Sustainability
- Sustainability Policies
- US Environmental Protection Agency
- Whole Earth