File:C02 in atmosphere chart-3.png: Difference between revisions
Siterunner (talk | contribs) No edit summary |
Siterunner (talk | contribs) No edit summary |
||
| (18 intermediate revisions by the same user not shown) | |||
| Line 1: | Line 1: | ||
<big><big><big>'''The Keeling Curve'''</big></big></big> | |||
[https://www.history.com/news/keeling-curve-global-warming-climate-change <big><big>'''The Keeling Curve: Watch It!'''</big></big>] | |||
:<big>'''Keeling's Curve has been called one of the most important scientific works of the 20th century'''</big> | |||
::<big>On Mauna Loa in Hawaii, decades of mountaintop CO2 measurements chart an ominous climate record</big> | |||
''Scripps Institute CO2 measurements at Mauna Loa have been supported for many years by the U.S. Department of Energy (DOE), and have more recently been supplemented by Earth Networks, a technology company collaborating with Scripps to expand the global GHG monitoring network. Support for website development was provided in part by the National Science Foundation (NSF).'' | |||
''NOAA additionally has been taking measurements of greenhouse gas emissions from the site since May 1974 in parallel with Scripps scientists.'' | |||
* https://gml.noaa.gov/ccgg/trends/ | |||
'''Oh NOAA, Oh Mauna Loa''' | |||
* https://gml.noaa.gov/ccgg/trends/graph.html | |||
https://gml.noaa.gov/webdata/ccgg/trends/co2_data_mlo.png | |||
<big>'''2023'''</big> | |||
<big>'''Hawaiian Volcanic Eruption Temporarily Disrupts the CO2 Measurements'''</big> | |||
:'''From the Mauna Loa site to a Mauna Kea site, the essential science data collection continues''' | |||
* https://www.nytimes.com/2023/02/06/climate/mauna-loa-carbon-dioxide-eruption.html | |||
* https://twitter.com/NCSE/status/1625310608097783809 | |||
<big>'''2022'''</big> | |||
* https://education.nationalgeographic.org/resource/keeling-curve | |||
<big>'''Year by Year, Measure and Monitor CO2 in the Atmosphere'''</big> | |||
* https://keelingcurve.ucsd.edu/ | |||
* https://keelingcurve.ucsd.edu/category/keeling-curve-history/ | |||
* https://keelingcurve.ucsd.edu/the-state-of-climate/ | |||
🌎 | |||
<big>'''2020 CO2: Metric Checking'''</big> | |||
[https://www.esrl.noaa.gov/gmd/ccgg/trends/monthly.html <big>'''February 10, 2020 / 416.08 ppm'''</big>] | |||
• https://www.esrl.noaa.gov/gmd/ccgg/trends/monthly.html | • https://www.esrl.noaa.gov/gmd/ccgg/trends/monthly.html | ||
| Line 6: | Line 63: | ||
• https://www.bloomberg.com/graphics/carbon-clock/ | • https://www.bloomberg.com/graphics/carbon-clock/ | ||
RISING EMISSIONS DRIVE GREENHOUSE GAS INDEX INCREASES | |||
RISING EMISSIONS DRIVE GREENHOUSE GAS INDEX INCREASE | * https://research.noaa.gov/article/ArtMID/587/ArticleID/2455/RISING-EMISSIONS-DRIVE-GREENHOUSE-GAS-INDEX-INCREASE | ||
[https://amp.cnn.com/cnn/2019/05/13/health/carbon-dioxide-world-intl/index.html <big>'''May 11, 2019 / 415.26 ppm'''</big>] | [https://amp.cnn.com/cnn/2019/05/13/health/carbon-dioxide-world-intl/index.html <big>'''May 11, 2019 / 415.26 ppm'''</big>] | ||
| Line 23: | Line 76: | ||
[[File:Mauna Loa-NOAA-Observatory.jpg]] | [[File:Mauna Loa-NOAA-Observatory.jpg]] | ||
About the Mauna Loa Observatory | |||
* https://gml.noaa.gov/obop/mlo/aboutus/aboutus.html | |||
| Line 30: | Line 88: | ||
: April 18: 413.43 ppm | : April 18: 413.43 ppm | ||
: April 17: 413.63 ppm | : April 17: 413.63 ppm | ||
:🌎 | |||
:[https://www.theguardian.com/environment/2019/apr/05/why-the-guardian-is-putting-global-co2-levels-in-the-weather-forecast '''CO2 Levels Now in the Weather Reports'''] | :[https://www.theguardian.com/environment/2019/apr/05/why-the-guardian-is-putting-global-co2-levels-in-the-weather-forecast '''CO2 Levels Now in the Weather Reports'''] | ||
:*'''https://www.esrl.noaa.gov/gmd/ccgg/trends/index.html''' | |||
:'''https://www.esrl.noaa.gov/gmd/ccgg/trends/ | :*'''https://www.esrl.noaa.gov/gmd/ccgg/trends/monthly.html''' | ||
:'''https://www.esrl.noaa.gov/gmd/ccgg/trends/full.html''' | :*'''https://www.esrl.noaa.gov/gmd/ccgg/trends/full.html''' | ||
········································································································ | |||
[[File:Mauna Loa - CO2 - Apr2019.jpg]] | [[File:Mauna Loa - CO2 - Apr2019.jpg]] | ||
[[File:Mauna loa CO2 record scripps.png]] | |||
🌎 | |||
[[Category:Anthropocene]] | |||
[[Category:Atmospheric Science]] | [[Category:Atmospheric Science]] | ||
[[Category:Climate Change]] | [[Category:Climate Change]] | ||
| Line 55: | Line 125: | ||
[[Category:Global Security]] | [[Category:Global Security]] | ||
[[Category:Green Graphics]] | [[Category:Green Graphics]] | ||
[[Category:Planet Citizens]] | |||
[[Category:Planet Citizens, Planet Scientists]] | |||
[[Category:Renewable Energy]] | |||
[[Category:Strategic Demands]] | |||
[[Category:Sustainability Policies]] | |||
[[Category:Whole Earth]] | |||
Latest revision as of 17:01, 25 September 2023
The Keeling Curve
- Keeling's Curve has been called one of the most important scientific works of the 20th century
- On Mauna Loa in Hawaii, decades of mountaintop CO2 measurements chart an ominous climate record
Scripps Institute CO2 measurements at Mauna Loa have been supported for many years by the U.S. Department of Energy (DOE), and have more recently been supplemented by Earth Networks, a technology company collaborating with Scripps to expand the global GHG monitoring network. Support for website development was provided in part by the National Science Foundation (NSF).
NOAA additionally has been taking measurements of greenhouse gas emissions from the site since May 1974 in parallel with Scripps scientists.
Oh NOAA, Oh Mauna Loa
https://gml.noaa.gov/webdata/ccgg/trends/co2_data_mlo.png
2023
Hawaiian Volcanic Eruption Temporarily Disrupts the CO2 Measurements
- From the Mauna Loa site to a Mauna Kea site, the essential science data collection continues
2022
Year by Year, Measure and Monitor CO2 in the Atmosphere
🌎
2020 CO2: Metric Checking
February 10, 2020 / 416.08 ppm
• https://www.esrl.noaa.gov/gmd/ccgg/trends/monthly.html
• https://www.bloomberg.com/graphics/carbon-clock/
RISING EMISSIONS DRIVE GREENHOUSE GAS INDEX INCREASES
According to data from the Mauna Loa Observatory in Hawaii, the concentration of CO2 in the atmosphere is over 415 parts per million (ppm)... far higher than at any point in the last 800,000 years, since before the evolution of homo sapiens.

About the Mauna Loa Observatory
- The Carbon Clock is Ticking
- April 19: 413.86 ppm
- April 18: 413.43 ppm
- April 17: 413.63 ppm
- 🌎
········································································································


🌎
File history
Click on a date/time to view the file as it appeared at that time.
| Date/Time | Thumbnail | Dimensions | User | Comment | |
|---|---|---|---|---|---|
| current | 16:15, 15 April 2017 | 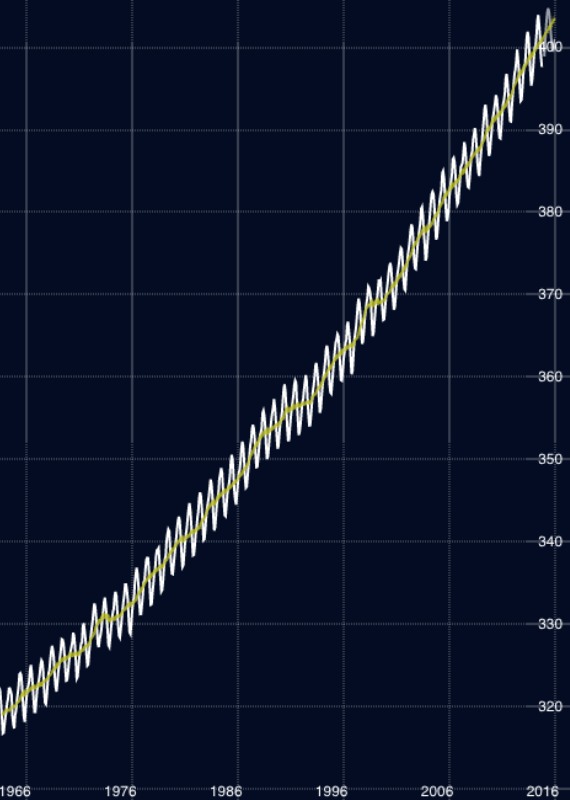 | 570 × 800 (133 KB) | Siterunner (talk | contribs) |
You cannot overwrite this file.
File usage
The following 15 pages use this file:
- Climate News
- Climate News Events Archive ... 1970 to Today
- Earth and Space, Politics
- Environmental full-cost accounting
- GreenPolicy360 Archive Highlights 2020
- Green Stories of the Day - GreenPolicy360 Archive
- Life and the 'Human Niche' at Risk
- Planet Citizens
- Too Hot
- File:Changes in carbon dioxide per 1000 years - via Climate Central.jpg
- File:Earth in Human Hands.jpg
- File:Earth trapping unprecedented amount of heat - NASA.jpg
- File:Gistemp 1979-2019.png
- File:Mauna Loa-NOAA-Observatory.jpg
- File:Temperatures New Normal is Not Normal.jpg