Category:Farm-Related Policies: Difference between revisions
Siterunner (talk | contribs) No edit summary |
Siterunner (talk | contribs) No edit summary |
||
| (7 intermediate revisions by the same user not shown) | |||
| Line 1: | Line 1: | ||
<addthis /> | |||
[[File:Featured.png]] | |||
'''Environmental Impact of the U.S. Food System''' | '''Environmental Impact of the U.S. Food System''' | ||
| Line 18: | Line 23: | ||
Environmental Impact of the US Food System | Environmental Impact of the US Food System | ||
1. The Environmental Impact of the US Food System By Rob Abrams | 1. The Environmental Impact of the US Food System | ||
:By Rob Abrams | |||
2. Outline I. Subsides II. Monoculture Soil depletion and erosion Water contamination III. GMOs Environmental benefits Environmental risks IV. Greenhouse gas emissions V. What can we do? | 2. Outline | ||
:I. Subsides | |||
:II. Monoculture Soil depletion and erosion Water contamination | |||
:III. GMOs Environmental benefits Environmental risks | |||
:IV. Greenhouse gas emissions | |||
:V. What can we do? | |||
3. SUBSIDIES | 3 / 4. SUBSIDIES • Farm Bill created during the Great Depression • Designed to compensate farmers during a period of excess supply • Renewed about every 5 years under various names • Current farm bill includes food assistance programs | ||
5. Current Bill (2014 – 2023) • http://www.washingtonpost.com/blo gs/wonkblog/wp/2014/01/28/the- 950-billion-farm-bill-in-one-chart/ | |||
6. Farm Bill • 10% of farms received 75% of subsidies • Top subsidized crops between 1995- 2012 are : • Corn: $84.4 billion • Wheat: $35.5 billion • Cotton: $32.8 billion • Soybean: 27.8 billion • (Note the lack of vegetables…) | |||
6. Farm Bill • 10% of farms received 75% of | |||
7. Farm Bill • Farm Bill subsidies have made production of those crops listed on the previous slide extremely profitable • This encourages large corporate farms to grow vast quantities of the same crops on the same land year after year in a practice called monocropping or monoculture. | 7. Farm Bill • Farm Bill subsidies have made production of those crops listed on the previous slide extremely profitable • This encourages large corporate farms to grow vast quantities of the same crops on the same land year after year in a practice called monocropping or monoculture. | ||
| Line 36: | Line 45: | ||
9. Monoculture • Monoculture relies on massive amounts of artificial fertilizers to replenish soil year after year • More pesticides and herbicides are also required than “traditional” farming techniques as monoculture fields are not as resilient • Leaves soil susceptible to erosion • Biodiversity of the surrounding ecosystem can be severely affected | 9. Monoculture • Monoculture relies on massive amounts of artificial fertilizers to replenish soil year after year • More pesticides and herbicides are also required than “traditional” farming techniques as monoculture fields are not as resilient • Leaves soil susceptible to erosion • Biodiversity of the surrounding ecosystem can be severely affected | ||
10. MONOCULTURE CONSEQUENCES Soil Depletion and Erosion http://www | 10. MONOCULTURE CONSEQUENCES Soil Depletion and Erosion • https://en.wikipedia.org/wiki/Monoculture • [notes-add] http://www.ucsusa.org/food_and_agriculture/our-failing-food-system/genetic-engineering/expanding-monoculture.html#.VkIv5b85SHg • http://www.theguardian.com/sustainable-business/food-system-monocultures-gm-un-diversity-day | ||
11. Soil Depletion and Erosion • Corn, wheat, and soybean monocultures require fertilizer, especially nitrogen because they are not rotated with nitrogen-fixing crops • 40% of all energy used in agriculture goes towards fertilizer and pesticide production2 • Production and mining of nitrogen fertilizer results in a significant amount of greenhouse gas release | 11. Soil Depletion and Erosion • Corn, wheat, and soybean monocultures require fertilizer, especially nitrogen because they are not rotated with nitrogen-fixing crops • 40% of all energy used in agriculture goes towards fertilizer and pesticide production2 • Production and mining of nitrogen fertilizer results in a significant amount of greenhouse gas release | ||
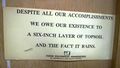
12. Soil Depletion and Erosion • Every year worldwide, about 12 billion hectares of farmable land is overused and abandoned because of unsustainable farming practices4 • In 2007, 1.73 billion tons of topsoil was lost due to erosion in the US7 • This amounts to 200,000 tons per hour | 12. Soil Depletion and Erosion • Every year worldwide, about 12 billion hectares of farmable land is overused and abandoned because of unsustainable farming practices4 • In 2007, 1.73 billion tons of topsoil was lost due to erosion in the US7 • This amounts to 200,000 tons per hour | ||
| Line 44: | Line 53: | ||
13. Soil Depletion and Erosion • Excess artificial fertilizers can result in trace mineral depletion in soil • This causes the land to produce crops that are lacking in minerals such as zinc, copper and manganese | 13. Soil Depletion and Erosion • Excess artificial fertilizers can result in trace mineral depletion in soil • This causes the land to produce crops that are lacking in minerals such as zinc, copper and manganese | ||
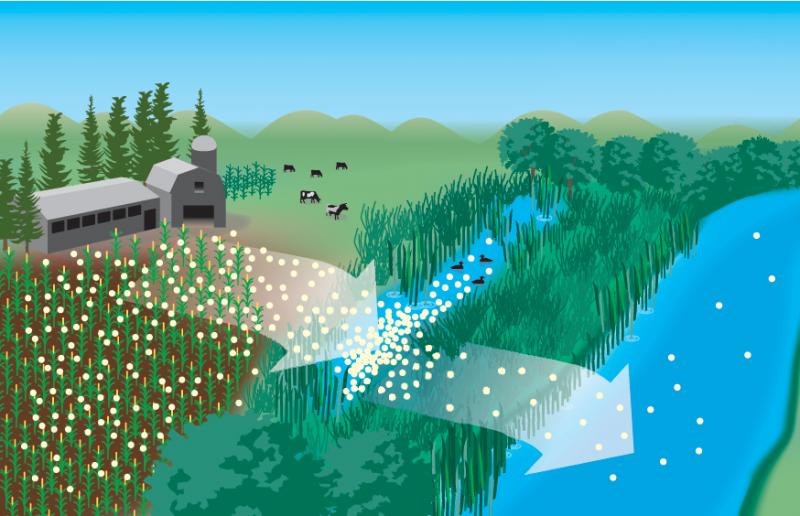
14. Soil Depletion and Erosion • It is estimated that annually, 2.5 billion dollars worth of excess fertilizer (that is, more than the crops could ever use) is applied every | 14. Soil Depletion and Erosion • It is estimated that annually, 2.5 billion dollars worth of excess fertilizer (that is, more than the crops could ever use) is applied every year • All of these excess nutrients have to go somewhere… | ||
15. | 15. Nitrogen runoff | ||
http://www.edf.org/sites/default/files/ecosystems/2011-EDF-NitrogenRunoff%23310.jpg | |||
16. Eutrophication • Nutrients from artificial fertilizers find their way into fresh water systems and oceans as well as ground water • Excess nutrients in aquatic ecosystems lead to eutrophication • Eutrophication occurs when algae and plankton reproduce due to nutrient abundance. The decomposition of the dead organisms leads to the depletion of oxygen in the water | 16. Eutrophication • Nutrients from artificial fertilizers find their way into fresh water systems and oceans as well as ground water • Excess nutrients in aquatic ecosystems lead to eutrophication • Eutrophication occurs when algae and plankton reproduce due to nutrient abundance. The decomposition of the dead organisms leads to the depletion of oxygen in the water | ||
17. Eutrophication • Algae blooms are a common indicator of eutrophication | 17. Eutrophication • Algae blooms are a common indicator of eutrophication | ||
18. Eutrophication | http://www.nysun.com/pics/5183.jpg | ||
18. Eutrophication farm runoff has lead to the deterioration of many fisheries • For example, runoff from farms in the Mississippi River watershed has led to a “dead zone” in Gulf of Mexico that is about 5,600 square miles in size | |||
19. Gulf of Mexico Dead Zone | 19. Gulf of Mexico Dead Zone | ||
http://www.nysun.com/pics/5183.jpg http://en.wikipedia.org/wiki/File:Dead_Zone_NASA_NOAA.jpg | http://www.nysun.com/pics/5183.jpg | ||
http://en.wikipedia.org/wiki/File:Dead_Zone_NASA_NOAA.jpg | |||
20. Pesticide Runoff • Excess pesticides also find their way into aquatic ecosystems • A USDA study found that 80% of urban streams and 50% of agricultural streams had concentrations of at least one pesticide above the USDA’s water quality benchmark for aquatic life | |||
21. GENETICALLY MODIFIED CROPS | |||
http://docakilah.files.w ordpress.com/2011/12/ genetically-modified.jpg | |||
22. GMOs • Genetically modified organisms (GMOs) are organisms that have been modified using genetic engineering • Advantages of GMOs are resistance to pests and shorter growing times • ''There is no scientific evidence that any currently produced genetically modified crops are any more dangerous to human health than normal crops [Disputed - note increasing international bans/restrictions on GMO]'' | |||
23. GENETICALLY MODIFIED CROPS Environmental Benefits | |||
http://www.theredmountainpost.com/org anic-farmers-report-increasing-gmo- contamination-with-corn-2-2235/ | |||
24. GMOs Environmental Benefits • Reduced pesticide spraying by 2.8 billion kg globally from 1996 to 2006 | |||
25. GMOs Environmental Benefits, Continued • Growth of GMO cotton has been documented to cause an increase in biodiversity and beneficial insect life in both the US and Australia (due to lower herbicide and pesticide use) | |||
26. GENETICALLY MODIFIED CROPS Environmental Risks | |||
http://www.realfoodhouston.com/2011/12/07/double-gm- whammy-for-the-monarch-butterfly/ / | |||
27. GMOs Environmental Risks • Outcrossing is the breeding of a domestic crop with a related species • GMO crops may create herbicide resistant weeds through outcrossing • This has not been a problem yet, but needs to be monitored on a case-by-case basis as new GMOs are introduced | |||
28. GMOs Environmental Risks, Continued • In a laboratory environment, insect resistant corn pollen negatively affected monarch butterfly larvae • Insect resistance to GMOs is always a concern, as it is with conventional pesticides | |||
29. Greenhouse Gas Emissions | |||
http://www.greenbiz.com/blog/2013/01/31/ocean-spray-shipping-emissions | |||
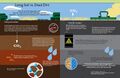
30. Greenhouse Gas Emissions The current US food system requires massive amounts of fossil fuel input to be maintained compared to how much food energy is actually produced | |||
http://css.snre.umich.edu/css_doc/CSS01-06.pdf | |||
31. Greenhouse Gas Emissions • Shipping from large monoculture farms contributes a large amount of CO2 in the atmosphere • On average, the typical American meal contains food from 5 different countries13 • It is estimated that the average America meal travels 1500 miles to get from farm to plate • For every 1 kcal of food consumed, 10 kcal of fossil fuel energy is used | |||
32. Greenhouse Gas Emissions | |||
http://css.snre.umich.edu/css_ doc/CSS01-06.pdf | |||
33. Greenhouse Gas Emissions • N2O is another greenhouse gas. It is created by microbial processes in heavily fertilized fields • Corn, the most heavily subsidized crop, is also one of the most nitrogen dependent | 33. Greenhouse Gas Emissions • N2O is another greenhouse gas. It is created by microbial processes in heavily fertilized fields • Corn, the most heavily subsidized crop, is also one of the most nitrogen dependent crops • N2O emissions from fertilizer accounts for 1.5% of all greenhouse gas emissions on the planet | ||
34. What Can We Do? http://www.cuesa.org/articl e/new-vendor-lonely- mountain-farm | 34. What Can We Do? http://www.cuesa.org/articl e/new-vendor-lonely- mountain-farm | ||
35. What Can We Do? • Eat local. Reduce the amount of fuel required to get food to you • Buy organic. • Not because its better for you, but because organic farming practices require less herbicide and pesticides (in theory) and therefore are better for the environment. • Fossil fuel use is also 30% less on organic farms than on conventional | 35. What Can We Do? • Eat local. Reduce the amount of fuel required to get food to you • Buy organic. • Not because its better for you, but because organic farming practices require less herbicide and pesticides (in theory) and therefore are better for the environment. • Fossil fuel use is also 30% less on organic farms than on conventional farms | ||
36. What Can We Do? • Buy organic, continued • Crop rotation instead of using massive amounts of fertilizer reduces water pollution and prevents soil | 36. What Can We Do? • Buy organic, continued • Crop rotation instead of using massive amounts of fertilizer reduces water pollution and prevents soil erosion • The more demand there is for organic produce, the more the big producers will begin to adopt organic farming practices on a large scale. | ||
37. References 1. Environmental Working Group. (2014). EWG Farm Subsidies: United States Summary Information. http://farm.ewg.org/region.php?fips=000000 2. Heller, M. and Keoleian, G. (2000). Life cycle-based sustainability indicators for assessment of the US food system. University of Michigan Center or Sustainable Systems, CSS00-04. 3. Sam Wood and Annette Cowie (2004). A Review of Greenhouse Gas Emission Factors for Fertiliser Production. IEA Bioenergy IEA Bioenergy. 4. Lal, R., and Stewart, B. (1990). Soil Degradation. Springer-Verlag, New York. 5. Board on Agriculture and Natural Resources, National Research Council. 2003. Frontiers in Agricultural Research: Food, Health, Environment, and Communities. Washington (DC): National Academies Press 6. Gilliom, R., Barbash, J., Crawford, C., Hamiliton, P., Martin, J., Nakagaki, N., Nowell, L., Scott, J., Stackelberg, P., Thelin, G., and Wolock, D. (2007). Pesticides in the Nation’s Streams and Ground Water, 1992-2001. USGS Circular 1291. http://pubs.usgs.gov/circ/2005/1291/ 7. USDA, National Resources Conservation Service. (2009). 2007 National Resource Survey. 8. American Association for the Advancement of Science (AAAS), Board of Directors (2012). "Legally Mandating GM Food Labels Could Mislead and Falsely Alarm Consumers. http://www.aaas.org/news/aaas-board-directors-legally-mandating-gm-food-labels- could-%E2%80%9Cmislead-and-falsely-alarm 9. Barfoot, P., & Brookes, G. (2007). Global impact of biotech crops: Socio-economic and environmental effects, 1996-2006. AgBioForum, 11(1), 21-38. http://www.agbioforum.org/v11n1/v11n1a03-brookes.htm 10. Carpenter, J, A Felsot, T Goode, M Hammig, D Onstad and S Sankula. (2002). Comparative environmental impacts of biotechnology-derived and traditional soybean, corn and cotton crops. Council for Agricultural Science and Technology, Ames, Iowa. 11. Government of Canada. (1994). Assessment criteria for determining environmental safety of plants with novel traits. Dir. 9408, Dec. 16, 1994. Plant Products Division, Plant Industry Directorate, Agriculture and Agri-food Canada. 12. Sear, M, RL Helmich, DE Stanley-Horn, KS Obenhauser, JM Pleasants, HR Matilla, BD Siegfried and GP Dively. 2001. Impact of Bt corn pollen on monarch butterfly. PNAS 98(21):11937-11942 13. National Resource Defense Council. (2007). Food Miles: How far your food travels has serious consequences to your health and the environment. http://food-hub.org/files/resources/Food%20Miles.pdf 14. CUESA. (2014). How far does your food travel to get to your plate? http://www.cuesa.org/learn/how-far-does-your-food-travel-get- your-plate 15. Iowa State University.(2008). Global warming – agriculture’s impact on greenhohttp://www.extension.iastate.edu/agdm/articles/others/TakApr08.htmluse gas emissions. 16. Pimentel, D., Hepperly, P., Hanson, J., Douds, D., and Seidel, R. (2005). Environmental, energetic, and economic comparisons of organic and conventional farming systems. BioScience(55)7: 573-582. http://bioscience.oxfordjournals.org/content/55/7/573.full | 37. References 1. Environmental Working Group. (2014). EWG Farm Subsidies: United States Summary Information. http://farm.ewg.org/region.php?fips=000000 2. Heller, M. and Keoleian, G. (2000). Life cycle-based sustainability indicators for assessment of the US food system. University of Michigan Center or Sustainable Systems, CSS00-04. 3. Sam Wood and Annette Cowie (2004). A Review of Greenhouse Gas Emission Factors for Fertiliser Production. IEA Bioenergy IEA Bioenergy. 4. Lal, R., and Stewart, B. (1990). Soil Degradation. Springer-Verlag, New York. 5. Board on Agriculture and Natural Resources, National Research Council. 2003. Frontiers in Agricultural Research: Food, Health, Environment, and Communities. Washington (DC): National Academies Press 6. Gilliom, R., Barbash, J., Crawford, C., Hamiliton, P., Martin, J., Nakagaki, N., Nowell, L., Scott, J., Stackelberg, P., Thelin, G., and Wolock, D. (2007). Pesticides in the Nation’s Streams and Ground Water, 1992-2001. USGS Circular 1291. http://pubs.usgs.gov/circ/2005/1291/ 7. USDA, National Resources Conservation Service. (2009). 2007 National Resource Survey. 8. American Association for the Advancement of Science (AAAS), Board of Directors (2012). "Legally Mandating GM Food Labels Could Mislead and Falsely Alarm Consumers. http://www.aaas.org/news/aaas-board-directors-legally-mandating-gm-food-labels- could-%E2%80%9Cmislead-and-falsely-alarm 9. Barfoot, P., & Brookes, G. (2007). Global impact of biotech crops: Socio-economic and environmental effects, 1996-2006. AgBioForum, 11(1), 21-38. http://www.agbioforum.org/v11n1/v11n1a03-brookes.htm 10. Carpenter, J, A Felsot, T Goode, M Hammig, D Onstad and S Sankula. (2002). Comparative environmental impacts of biotechnology-derived and traditional soybean, corn and cotton crops. Council for Agricultural Science and Technology, Ames, Iowa. 11. Government of Canada. (1994). Assessment criteria for determining environmental safety of plants with novel traits. Dir. 9408, Dec. 16, 1994. Plant Products Division, Plant Industry Directorate, Agriculture and Agri-food Canada. 12. Sear, M, RL Helmich, DE Stanley-Horn, KS Obenhauser, JM Pleasants, HR Matilla, BD Siegfried and GP Dively. 2001. Impact of Bt corn pollen on monarch butterfly. PNAS 98(21):11937-11942 13. National Resource Defense Council. (2007). Food Miles: How far your food travels has serious consequences to your health and the environment. http://food-hub.org/files/resources/Food%20Miles.pdf 14. CUESA. (2014). How far does your food travel to get to your plate? http://www.cuesa.org/learn/how-far-does-your-food-travel-get- your-plate 15. Iowa State University.(2008). Global warming – agriculture’s impact on greenhohttp://www.extension.iastate.edu/agdm/articles/others/TakApr08.htmluse gas emissions. 16. Pimentel, D., Hepperly, P., Hanson, J., Douds, D., and Seidel, R. (2005). Environmental, energetic, and economic comparisons of organic and conventional farming systems. BioScience(55)7: 573-582. http://bioscience.oxfordjournals.org/content/55/7/573.full | ||
Latest revision as of 22:00, 14 April 2019
<addthis />

Environmental Impact of the U.S. Food System
http://www.slideshare.net/robabrams/environmental-impact-of-the-us-food-system
Larger Farms vs Smaller Farms (US)
http://grist.org/food/america-has-fewer-and-larger-farms-heres-why-that-matters/
http://grist.org/food/these-charts-show-why-corn-is-king/
__________________________________________
Environmental Impact of the US Food System
1. The Environmental Impact of the US Food System
- By Rob Abrams
2. Outline
- I. Subsides
- II. Monoculture Soil depletion and erosion Water contamination
- III. GMOs Environmental benefits Environmental risks
- IV. Greenhouse gas emissions
- V. What can we do?
3 / 4. SUBSIDIES • Farm Bill created during the Great Depression • Designed to compensate farmers during a period of excess supply • Renewed about every 5 years under various names • Current farm bill includes food assistance programs
5. Current Bill (2014 – 2023) • http://www.washingtonpost.com/blo gs/wonkblog/wp/2014/01/28/the- 950-billion-farm-bill-in-one-chart/
6. Farm Bill • 10% of farms received 75% of subsidies • Top subsidized crops between 1995- 2012 are : • Corn: $84.4 billion • Wheat: $35.5 billion • Cotton: $32.8 billion • Soybean: 27.8 billion • (Note the lack of vegetables…)
7. Farm Bill • Farm Bill subsidies have made production of those crops listed on the previous slide extremely profitable • This encourages large corporate farms to grow vast quantities of the same crops on the same land year after year in a practice called monocropping or monoculture.
8. MONOCULTURE
9. Monoculture • Monoculture relies on massive amounts of artificial fertilizers to replenish soil year after year • More pesticides and herbicides are also required than “traditional” farming techniques as monoculture fields are not as resilient • Leaves soil susceptible to erosion • Biodiversity of the surrounding ecosystem can be severely affected
10. MONOCULTURE CONSEQUENCES Soil Depletion and Erosion • https://en.wikipedia.org/wiki/Monoculture • [notes-add] http://www.ucsusa.org/food_and_agriculture/our-failing-food-system/genetic-engineering/expanding-monoculture.html#.VkIv5b85SHg • http://www.theguardian.com/sustainable-business/food-system-monocultures-gm-un-diversity-day
11. Soil Depletion and Erosion • Corn, wheat, and soybean monocultures require fertilizer, especially nitrogen because they are not rotated with nitrogen-fixing crops • 40% of all energy used in agriculture goes towards fertilizer and pesticide production2 • Production and mining of nitrogen fertilizer results in a significant amount of greenhouse gas release
12. Soil Depletion and Erosion • Every year worldwide, about 12 billion hectares of farmable land is overused and abandoned because of unsustainable farming practices4 • In 2007, 1.73 billion tons of topsoil was lost due to erosion in the US7 • This amounts to 200,000 tons per hour
13. Soil Depletion and Erosion • Excess artificial fertilizers can result in trace mineral depletion in soil • This causes the land to produce crops that are lacking in minerals such as zinc, copper and manganese
14. Soil Depletion and Erosion • It is estimated that annually, 2.5 billion dollars worth of excess fertilizer (that is, more than the crops could ever use) is applied every year • All of these excess nutrients have to go somewhere…
15. Nitrogen runoff
http://www.edf.org/sites/default/files/ecosystems/2011-EDF-NitrogenRunoff%23310.jpg
16. Eutrophication • Nutrients from artificial fertilizers find their way into fresh water systems and oceans as well as ground water • Excess nutrients in aquatic ecosystems lead to eutrophication • Eutrophication occurs when algae and plankton reproduce due to nutrient abundance. The decomposition of the dead organisms leads to the depletion of oxygen in the water
17. Eutrophication • Algae blooms are a common indicator of eutrophication
http://www.nysun.com/pics/5183.jpg
18. Eutrophication farm runoff has lead to the deterioration of many fisheries • For example, runoff from farms in the Mississippi River watershed has led to a “dead zone” in Gulf of Mexico that is about 5,600 square miles in size
19. Gulf of Mexico Dead Zone
http://www.nysun.com/pics/5183.jpg
http://en.wikipedia.org/wiki/File:Dead_Zone_NASA_NOAA.jpg
20. Pesticide Runoff • Excess pesticides also find their way into aquatic ecosystems • A USDA study found that 80% of urban streams and 50% of agricultural streams had concentrations of at least one pesticide above the USDA’s water quality benchmark for aquatic life
21. GENETICALLY MODIFIED CROPS
http://docakilah.files.w ordpress.com/2011/12/ genetically-modified.jpg
22. GMOs • Genetically modified organisms (GMOs) are organisms that have been modified using genetic engineering • Advantages of GMOs are resistance to pests and shorter growing times • There is no scientific evidence that any currently produced genetically modified crops are any more dangerous to human health than normal crops [Disputed - note increasing international bans/restrictions on GMO]
23. GENETICALLY MODIFIED CROPS Environmental Benefits
http://www.theredmountainpost.com/org anic-farmers-report-increasing-gmo- contamination-with-corn-2-2235/
24. GMOs Environmental Benefits • Reduced pesticide spraying by 2.8 billion kg globally from 1996 to 2006
25. GMOs Environmental Benefits, Continued • Growth of GMO cotton has been documented to cause an increase in biodiversity and beneficial insect life in both the US and Australia (due to lower herbicide and pesticide use)
26. GENETICALLY MODIFIED CROPS Environmental Risks
http://www.realfoodhouston.com/2011/12/07/double-gm- whammy-for-the-monarch-butterfly/ /
27. GMOs Environmental Risks • Outcrossing is the breeding of a domestic crop with a related species • GMO crops may create herbicide resistant weeds through outcrossing • This has not been a problem yet, but needs to be monitored on a case-by-case basis as new GMOs are introduced
28. GMOs Environmental Risks, Continued • In a laboratory environment, insect resistant corn pollen negatively affected monarch butterfly larvae • Insect resistance to GMOs is always a concern, as it is with conventional pesticides
29. Greenhouse Gas Emissions
http://www.greenbiz.com/blog/2013/01/31/ocean-spray-shipping-emissions
30. Greenhouse Gas Emissions The current US food system requires massive amounts of fossil fuel input to be maintained compared to how much food energy is actually produced
http://css.snre.umich.edu/css_doc/CSS01-06.pdf
31. Greenhouse Gas Emissions • Shipping from large monoculture farms contributes a large amount of CO2 in the atmosphere • On average, the typical American meal contains food from 5 different countries13 • It is estimated that the average America meal travels 1500 miles to get from farm to plate • For every 1 kcal of food consumed, 10 kcal of fossil fuel energy is used
32. Greenhouse Gas Emissions
http://css.snre.umich.edu/css_ doc/CSS01-06.pdf
33. Greenhouse Gas Emissions • N2O is another greenhouse gas. It is created by microbial processes in heavily fertilized fields • Corn, the most heavily subsidized crop, is also one of the most nitrogen dependent crops • N2O emissions from fertilizer accounts for 1.5% of all greenhouse gas emissions on the planet
34. What Can We Do? http://www.cuesa.org/articl e/new-vendor-lonely- mountain-farm
35. What Can We Do? • Eat local. Reduce the amount of fuel required to get food to you • Buy organic. • Not because its better for you, but because organic farming practices require less herbicide and pesticides (in theory) and therefore are better for the environment. • Fossil fuel use is also 30% less on organic farms than on conventional farms
36. What Can We Do? • Buy organic, continued • Crop rotation instead of using massive amounts of fertilizer reduces water pollution and prevents soil erosion • The more demand there is for organic produce, the more the big producers will begin to adopt organic farming practices on a large scale.
37. References 1. Environmental Working Group. (2014). EWG Farm Subsidies: United States Summary Information. http://farm.ewg.org/region.php?fips=000000 2. Heller, M. and Keoleian, G. (2000). Life cycle-based sustainability indicators for assessment of the US food system. University of Michigan Center or Sustainable Systems, CSS00-04. 3. Sam Wood and Annette Cowie (2004). A Review of Greenhouse Gas Emission Factors for Fertiliser Production. IEA Bioenergy IEA Bioenergy. 4. Lal, R., and Stewart, B. (1990). Soil Degradation. Springer-Verlag, New York. 5. Board on Agriculture and Natural Resources, National Research Council. 2003. Frontiers in Agricultural Research: Food, Health, Environment, and Communities. Washington (DC): National Academies Press 6. Gilliom, R., Barbash, J., Crawford, C., Hamiliton, P., Martin, J., Nakagaki, N., Nowell, L., Scott, J., Stackelberg, P., Thelin, G., and Wolock, D. (2007). Pesticides in the Nation’s Streams and Ground Water, 1992-2001. USGS Circular 1291. http://pubs.usgs.gov/circ/2005/1291/ 7. USDA, National Resources Conservation Service. (2009). 2007 National Resource Survey. 8. American Association for the Advancement of Science (AAAS), Board of Directors (2012). "Legally Mandating GM Food Labels Could Mislead and Falsely Alarm Consumers. http://www.aaas.org/news/aaas-board-directors-legally-mandating-gm-food-labels- could-%E2%80%9Cmislead-and-falsely-alarm 9. Barfoot, P., & Brookes, G. (2007). Global impact of biotech crops: Socio-economic and environmental effects, 1996-2006. AgBioForum, 11(1), 21-38. http://www.agbioforum.org/v11n1/v11n1a03-brookes.htm 10. Carpenter, J, A Felsot, T Goode, M Hammig, D Onstad and S Sankula. (2002). Comparative environmental impacts of biotechnology-derived and traditional soybean, corn and cotton crops. Council for Agricultural Science and Technology, Ames, Iowa. 11. Government of Canada. (1994). Assessment criteria for determining environmental safety of plants with novel traits. Dir. 9408, Dec. 16, 1994. Plant Products Division, Plant Industry Directorate, Agriculture and Agri-food Canada. 12. Sear, M, RL Helmich, DE Stanley-Horn, KS Obenhauser, JM Pleasants, HR Matilla, BD Siegfried and GP Dively. 2001. Impact of Bt corn pollen on monarch butterfly. PNAS 98(21):11937-11942 13. National Resource Defense Council. (2007). Food Miles: How far your food travels has serious consequences to your health and the environment. http://food-hub.org/files/resources/Food%20Miles.pdf 14. CUESA. (2014). How far does your food travel to get to your plate? http://www.cuesa.org/learn/how-far-does-your-food-travel-get- your-plate 15. Iowa State University.(2008). Global warming – agriculture’s impact on greenhohttp://www.extension.iastate.edu/agdm/articles/others/TakApr08.htmluse gas emissions. 16. Pimentel, D., Hepperly, P., Hanson, J., Douds, D., and Seidel, R. (2005). Environmental, energetic, and economic comparisons of organic and conventional farming systems. BioScience(55)7: 573-582. http://bioscience.oxfordjournals.org/content/55/7/573.full
Subcategories
This category has the following 3 subcategories, out of 3 total.
Pages in category "Farm-Related Policies"
The following 75 pages are in this category, out of 75 total.
A
- Agriculture
- Agroecological Farming
- Allegheny College, PA Local Foods Network
- Alternative Agriculture
- Antibiotics, Farming, Livestock Industry
- Arcata, CA Ordinance to Regulate Genetically Engineered Organisms
- Ashtabula County, OH Soil And Water Conservation District Farmland Preservation Executive Summary
B
- Berea College, KY Local Food Initiative
- Berkeley, CA Endorsing Prevention of Farm Animal Cruelty Act
- Berkeley, CA Opposing Efforts to Impede Local Governments from Regulating GE Plants and Food
- Bernards Township, NJ Farmland Preservation Resolution
- Book Reviews @GreenPolicy
- Boulder, CO Bans Genetically Engineered Crops from City-Owned Land
- Brooklin, ME Votes to be GMO-Free Zone
C
- Campus Supported Agriculture Program, Georgia Institute of Technology
- Carbon Sequestration
- Charlemont, MA Resolution on a Moratorium on Genetically Engineered Crops
- College of the Atlantic, ME Farm to Food
- Community Supported Agriculture
- Cornell University, NY Agricultural Composting Program
- Creatively Green
D
G
I
L
M
O
P
S
- San Francisco, CA Urging Against the Purchase of Eggs Produced by Caged Hens
- San Luis Obispo County, CA Failed Initiative to Prohibit the Growing of Genetically Engineered Organisms
- Santa Cruz, CA Ordinance Establishing a Moratorium on Genetically Engineered Crops
- Santa Fe County, NM Declaration of Seed Sovereignty
- Seed Saving
- Slow Food (Alternative to Fast Food)
- Soil Loss
- Sonoma County, CA Ordinance to Prevent Agricultural and Environmental Contamination from GE Organisms
- St. Lawrence University, NY Sustainable Food Systems
T
W
Media in category "Farm-Related Policies"
The following 89 files are in this category, out of 89 total.
 AB 2480 Meadows and Forest Water Infrastructure.png 481 × 375; 248 KB
 Apple varietals.jpg 600 × 314; 30 KB
 Arable land percent world.png 1,357 × 628; 40 KB
 ArcGIS-logo.png 302 × 167; 7 KB
 Big Chicken.jpg 298 × 450; 35 KB
 Biggest little farm-1.jpg 800 × 533; 123 KB
 Biggest-Little-Farm.png 665 × 319; 455 KB
 Bill Mollison 1928-2016.pdf ; 99 KB
 Bill Mollison courtesy of Permaculture magazine.jpg 460 × 300; 0 bytes
 Bill Mollison experience.png 792 × 612; 459 KB
 Bill Mollison the day after his passing memories.png 1,381 × 651; 1.65 MB
 Blog-soil.jpg 722 × 491; 58 KB
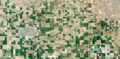 California's Central Valley Earth View June 2015.png 1,571 × 767; 0 bytes
 Carbon cycle NOAA.jpg 640 × 480; 63 KB
 Celebrating 50 Years of Landsat.png 600 × 610; 909 KB
 Cisterns rebateprogram.jpg 628 × 390; 355 KB
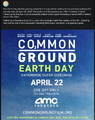 Common Ground, the Movie.png 600 × 756; 775 KB
 CSA Community Supported Agriculture practices.jpg 500 × 332; 33 KB
 Deborah Madison books 2017 photo courtesy of Deborah-in-Santa Fe.jpg 800 × 530; 81 KB
 Dirt, soil, worms, good.png 700 × 399; 695 KB
 Disaster scenarios raise the stakes for Colorado River - 1.png 640 × 213; 56 KB
 Disaster scenarios raise the stakes for Colorado River - 2.png 640 × 154; 14 KB
 Dr Volts talks of lawns and their problems.jpg 492 × 376; 49 KB
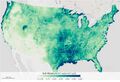
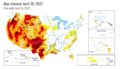 Drought Monitor Map - April 2022.png 800 × 459; 238 KB
 ESRI logo.jpg 366 × 138; 10 KB
 Farm du Bec Hellouin.jpg 800 × 480; 139 KB
 FarmersMarkets logos.png 1,533 × 537; 1.24 MB
 Florida strawberry festival.jpg 800 × 450; 63 KB
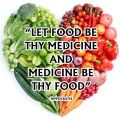 Food as medicine.jpg 480 × 480; 56 KB
 FOOD politics-health.jpg 462 × 145; 43 KB
 Food Principles.jpg 534 × 400; 186 KB
 Food wasted-lost.png 708 × 715; 376 KB
 FOOD.jpg 983 × 311; 117 KB
 Geosciences satellite fields b.jpg 461 × 444; 186 KB
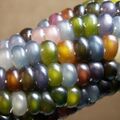 Glass Gem Corn.jpg 400 × 400; 21 KB
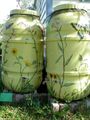 Green Rain Barrels.jpg 576 × 768; 95 KB
 GreenBook-icon.png 128 × 128; 2 KB
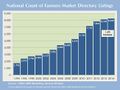 Growth of Farmers Markets in US 1994-2014.jpg 650 × 488; 186 KB
 Harvest the Rain cover .png 582 × 800; 1.06 MB
 Harvest the Rain reviews.png 800 × 879; 306 KB
 Healthy-soil.jpg 930 × 325; 97 KB
 Kenny Ausubel quote.jpeg 415 × 163; 46 KB
 Land Remote Sensing Policy Act of 1992.jpg 563 × 480; 144 KB
 Landsat band imagery2.png 800 × 400; 907 KB
 Landsat data site.png 657 × 600; 499 KB
 Landsat launched 50 years ago today.png 528 × 779; 755 KB
 Landsat NASA - Feb 11 2023.png 763 × 600; 578 KB
 Landsat US collection of maps 1985-2021.png 768 × 775; 1,018 KB
 Landsat, a 50 year legacy.png 528 × 575; 288 KB
 Lawn1.jpg 1,024 × 431; 135 KB
 Lawton on Mollison Permaculture.png 491 × 352; 179 KB
 Living Diversity or Not in Your Home Yard.png 436 × 640; 582 KB
 Market Gardening.png 800 × 334; 526 KB
 Modelo didatico bovino correto.jpg 640 × 420; 59 KB
 Mollison Memory.jpg 612 × 642; 82 KB
 Netherlands agriculture - Outstanding results globally.jpg 680 × 674; 77 KB
 Organic - 'Natural' Products companies Corp acquisitions US 1997-2014.png 1,098 × 840; 1.07 MB
 Organic food 1a.png 609 × 458; 400 KB
- Organic-chart-Jan-2016.pdf ; 136 KB
 Organicagric.jpg 800 × 342; 31 KB
 Permaculture-observation tip.jpg 480 × 540; 86 KB
 Rain Garden Design courtesy of www.PermaDesign.com Nate Downey.png 800 × 614; 601 KB
 RainBarrels UNM.jpg 450 × 224; 53 KB
 Regenerative Ag - Kiss the Ground - The Secret is in the Soil.png 800 × 800; 1.07 MB
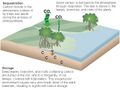
 River basins - watersheds.jpg 800 × 214; 111 KB
 Save Food.jpg 300 × 168; 5 KB
 SaveFood, CutWaste.jpg 200 × 200; 12 KB
 Seed-monopoly-consolidation-chart-2018.jpg 800 × 533; 318 KB
 Seeds of Change, published 1994.png 628 × 763; 915 KB
 Seeds of Change.jpg 260 × 346; 27 KB
 Seeds, time lapse.png 800 × 428; 297 KB
 Slow Food Initiatives 2015.png 1,004 × 802; 278 KB
 Slow Food.jpg 266 × 190; 11 KB
 SlowFood viatimthumb.jpg 620 × 300; 139 KB
 Soil and mycelium mycorrhizal fungi network threads.png 600 × 800; 699 KB
 Soil is the root stuff.jpg 483 × 960; 97 KB
 Soil-vs-dirt-infographic.jpg 887 × 578; 115 KB
 Stop Wasting Food.jpg 900 × 679; 70 KB
 Sustainable agriculture.jpg 960 × 360; 247 KB
 The Big Waste.png 640 × 420; 560 KB
 The Greens Cookbook.jpg 116 × 225; 7 KB
 To a layer of topsoil MN-SD.jpg 960 × 540; 61 KB
 Toby Hemenway-RIP Dec2016.png 503 × 327; 32 KB
 US River basins - watersheds.jpg 800 × 477; 131 KB
 Via Dr Stacey Robinson.JPG 800 × 789; 238 KB
 WaterConservation.jpg 361 × 545; 26 KB


