File:Mauna Kea.jpg: Difference between revisions
Siterunner (talk | contribs) No edit summary |
Siterunner (talk | contribs) No edit summary |
||
| Line 1: | Line 1: | ||
<small>Composite Image: oleksandr_mokrohuz</small> | |||
<big><big>'''CO2 Measurements @Mauna Loa, Hawaii'''</big></big> | |||
• https://www.esrl.noaa.gov/gmd/ccgg/trends/ | |||
• https://www.esrl.noaa.gov/gmd/ccgg/trends/full.html | |||
• https://scripps.ucsd.edu/programs/keelingcurve/ | |||
'''Highest Daily CO2 Records (by year) | Mauna Loa Observatory''' | |||
Measurements are made by two independent CO2 monitoring programs (NOAA and Scripps) at the Mauna Loa Observatory in Hawaii about 3400 metres above sea level. | |||
'''2019''' (as of January 12, 2019) | |||
413.45 ppm on January 12, 2019 (NOAA-ESRL) | |||
411.14 ppm on January 7, 2019 (Scripps) | |||
411.08 ppm on January 6, 2019 (Scripps) | |||
'''2018''' | |||
412.60 ppm on May 14, 2018 (Scripps) | |||
412.45 ppm on May 14, 2018 (NOAA-ESRL) | |||
412.37 ppm on April 23, 2018 (NOAA-ESRL) | |||
'''2017''' | |||
412.63 ppm on April 26, 2017 (NOAA-ESRL) | |||
411.27 ppm on May 15, 2017 (NOAA-ESRL) | |||
'''2016''' | |||
409.44 ppm on April 9, 2016 (Scripps) | |||
409.39 ppm on April 8, 2016 (Scripps) | |||
'''2015''' | |||
404.84 ppm on April 13, 2015 (Scripps) | |||
[[Category:Atmospheric Science]] | |||
[[Category:Climate Change]] | |||
[[Category:Earth Science]] | |||
[[Category:Ecology Studies]] | |||
[[Category:Environmental Security]] | |||
[[Category:Global Security]] | |||
[[Category:Green Graphics]] | |||
[[Category:Hawaii]] | |||
[[Category:New Definitions of National Security]] | |||
[[Category:Planet Citizens]] | |||
[[Category:Planet Citizens, Planet Scientists]] | |||
[[Category:Strategic Demands]] | |||
[[Category:Whole Earth]] | |||
Revision as of 16:58, 18 January 2019
Composite Image: oleksandr_mokrohuz
CO2 Measurements @Mauna Loa, Hawaii
• https://www.esrl.noaa.gov/gmd/ccgg/trends/
• https://www.esrl.noaa.gov/gmd/ccgg/trends/full.html
• https://scripps.ucsd.edu/programs/keelingcurve/
Highest Daily CO2 Records (by year) | Mauna Loa Observatory
Measurements are made by two independent CO2 monitoring programs (NOAA and Scripps) at the Mauna Loa Observatory in Hawaii about 3400 metres above sea level.
2019 (as of January 12, 2019)
413.45 ppm on January 12, 2019 (NOAA-ESRL)
411.14 ppm on January 7, 2019 (Scripps)
411.08 ppm on January 6, 2019 (Scripps)
2018
412.60 ppm on May 14, 2018 (Scripps)
412.45 ppm on May 14, 2018 (NOAA-ESRL)
412.37 ppm on April 23, 2018 (NOAA-ESRL)
2017
412.63 ppm on April 26, 2017 (NOAA-ESRL)
411.27 ppm on May 15, 2017 (NOAA-ESRL)
2016
409.44 ppm on April 9, 2016 (Scripps)
409.39 ppm on April 8, 2016 (Scripps)
2015
404.84 ppm on April 13, 2015 (Scripps)
File history
Click on a date/time to view the file as it appeared at that time.
| Date/Time | Thumbnail | Dimensions | User | Comment | |
|---|---|---|---|---|---|
| current | 16:49, 18 January 2019 | 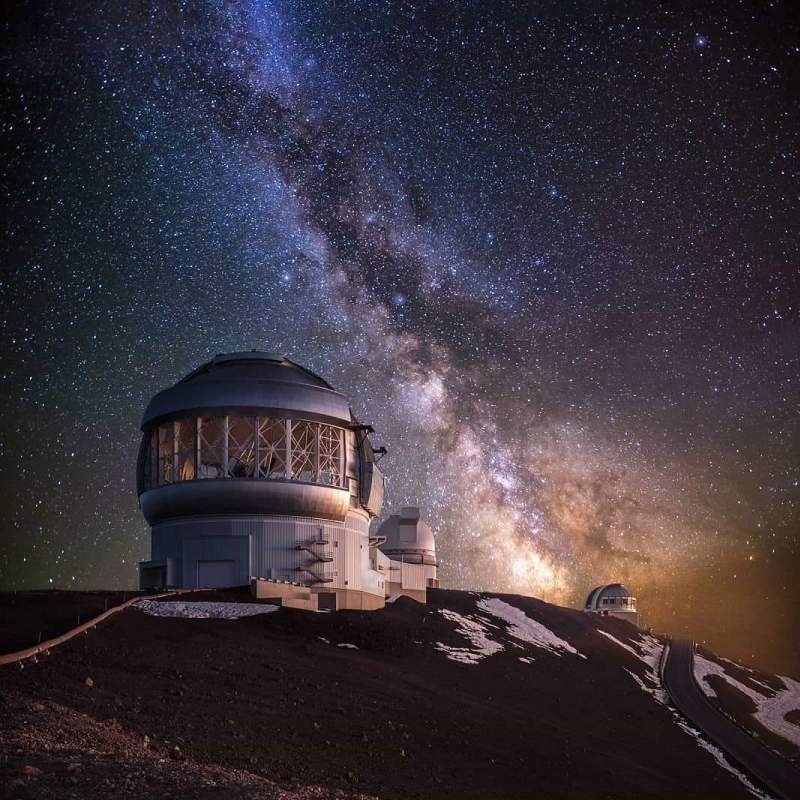 | 800 × 800 (97 KB) | Siterunner (talk | contribs) |
You cannot overwrite this file.
File usage
The following page uses this file: