File:USGS Groundwater depletion map 2013.png
USGS_Groundwater_depletion_map_2013.png (794 × 490 pixels, file size: 238 KB, MIME type: image/png)
http://www.reuters.com/article/us-usa-water-idUSBRE94J0Y920130520
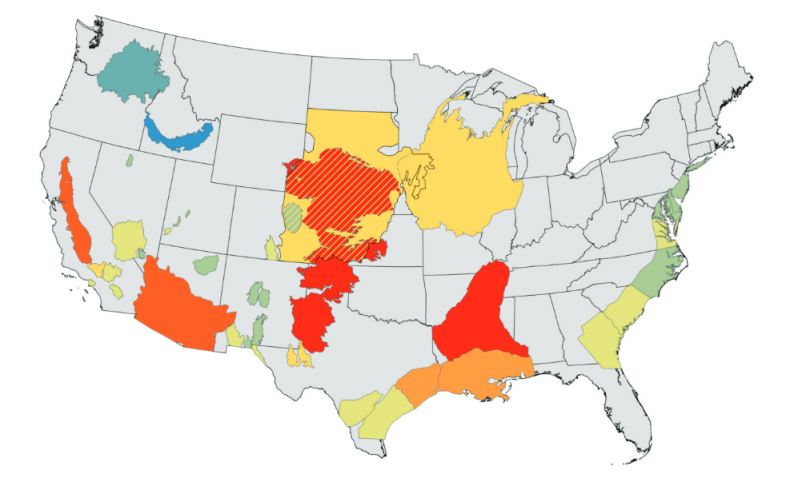
Water levels in U.S. aquifers, the vast underground storage areas tapped for agriculture, energy and human consumption, between 2000 and 2008 dropped at a rate that was almost three times as great as any time during the 20th century, U.S. officials said on Monday.
The accelerated decline in the subterranean reservoirs is due to a combination of factors, most of them linked to rising population in the United States, according to Leonard Konikow, a research hydrologist at the U.S. Geological Survey.
The big rise in water use started in 1950, at the time of an economic boom and the spread of U.S. suburbs. However, the steep increase in water use and the drop in groundwater levels that followed World War 2 were eclipsed by the changes during the first years of the 21st century, the study showed...
__________________________________________________
http://pubs.usgs.gov/sir/2013/5079/SIR2013-5079.pdf
1900-2008
Groundwater Depletion in the United States (1900−2008)
- By Leonard F. Konikow / USGS
Abstract
A natural consequence of groundwater withdrawals is the removal of water from subsurface storage, but the overall rates and magnitude of groundwater depletion in the United States are not well characterized.
This study evaluates long-term cumulative depletion volumes in 40 separate aquifers or areas and one land use category in the United States, bringing together information from the literature and from new analyses. Depletion is directly calculated using calibrated groundwater models, analytical approaches, or volumetric budget analyses for multiple aquifer systems. Estimated groundwater depletion in the United States during 1900–2008 totals approximately 1,000 cubic kilometers (km3). Furthermore, the rate of groundwater depletion has increased markedly since about 1950, with maximum rates occurring during the most recent period (2000–2008) when the depletion rate averaged almost 25 km3 per year (compared to 9.2 km3 per year averaged over the 1900–2008 timeframe).
File history
Click on a date/time to view the file as it appeared at that time.
| Date/Time | Thumbnail | Dimensions | User | Comment | |
|---|---|---|---|---|---|
| current | 16:59, 28 May 2016 | | 794 × 490 (238 KB) | Siterunner (talk | contribs) |
You cannot overwrite this file.
File usage
The following page uses this file:
- Aquifers
- Citizen Science
- Climate Change
- Desertification
- Earth360
- Earth Observations
- Earth Science
- Earth Science from Space
- Environmental Full-cost Accounting
- Environmental Security
- Environmental Security, National Security
- EOS eco Operating System
- Geophysics and Geochemistry
- Geology
- Geophysics
- Hydrology
- Natural Resources
- Permaculture
- Planet API
- Planet Citizen
- Planet Scientist
- Planet Citizens, Planet Scientists
- Planetary Science
- Sustainability
- Sustainability Policies
- Virtual Earth
- Virtual Planet
- Water
- Water Saving
- Wetlands
- Whole Earth