File:Mauna Loa - CO2 - Feb2019.jpg: Difference between revisions
Siterunner (talk | contribs) No edit summary |
Siterunner (talk | contribs) No edit summary |
||
| Line 9: | Line 9: | ||
''2018's max monthly Mauna Loa CO2 concentration was 411.3 ppm in May. The @Keeling_curve mean for February so far is 411.8 ppm. Looks like the previous year's record is being breached early this year.'' | ''2018's max monthly Mauna Loa CO2 concentration was 411.3 ppm in May. The [https://en.wikipedia.org/wiki/Keeling_Curve @Keeling_curve] mean for February so far is 411.8 ppm. Looks like the previous year's record is being breached early this year.'' | ||
Revision as of 00:20, 19 February 2019
<addthis />
Observing CO2 Levels
Highest weekly average CO2 ever measured at Mauna Loa: 412.4 ppm, almost 4 ppm above same time last year.
February seems on its way to end as highest month too, most probably for the last 2 million years.
2018's max monthly Mauna Loa CO2 concentration was 411.3 ppm in May. The @Keeling_curve mean for February so far is 411.8 ppm. Looks like the previous year's record is being breached early this year.
Highest Daily CO2 Records (by year) | Mauna Loa Observatory
Measurements are made by two independent CO2 monitoring programs (NOAA and Scripps) at the Mauna Loa Observatory in Hawaii about 3400 metres above sea level.
2019 (as of January 12, 2019)
413.45 ppm on January 12, 2019 (NOAA-ESRL)
411.14 ppm on January 7, 2019 (Scripps)
411.08 ppm on January 6, 2019 (Scripps)
○
File history
Click on a date/time to view the file as it appeared at that time.
| Date/Time | Thumbnail | Dimensions | User | Comment | |
|---|---|---|---|---|---|
| current | 00:05, 19 February 2019 | 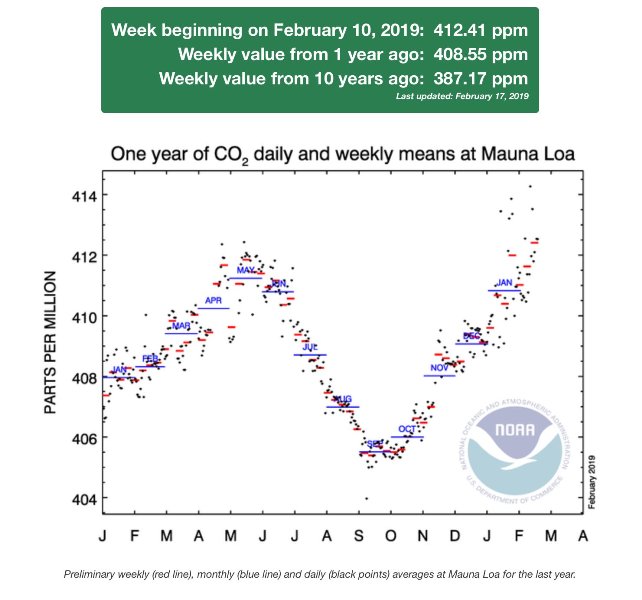 | 642 × 600 (57 KB) | Siterunner (talk | contribs) |
You cannot overwrite this file.
File usage
The following 2 pages use this file: