Search results
Jump to navigation
Jump to search
Page title matches
File:Mauna Loa-NOAA-Observatory.jpg : About the Mauna Loa Observatory ''Scripps CO2 measurements at Mauna Loa have been supported for many years by the U.S. Department of Energy (DOE),(800 × 450 (77 KB)) - 16:26, 28 November 2022
File:Mauna Loa - CO2 - Apr2019.jpg Mauna Loa, Hawaii / Global / CO2 Movie / CO2 Emissions '''Highest Daily CO2 Records (by year) | Mauna Loa Observatory'''(642 × 600 (78 KB)) - 13:27, 6 April 2019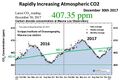
File:Mauna Loa-Dec30 2017.jpg (800 × 535 (57 KB)) - 21:14, 5 January 2018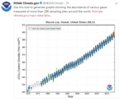
File:Mauna Loa CO2 graph.png (581 × 486 (126 KB)) - 15:44, 30 November 2017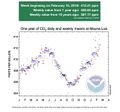
File:Mauna Loa - CO2 - Feb2019.jpg ''Highest weekly average CO2 ever measured at Mauna Loa: 412.4 ppm, almost 4 ppm above same time last year.'' ''2018's max monthly Mauna Loa CO2 concentration was 411.3 ppm in May. The [https://en.wikipedia.org/wiki/(642 × 600 (57 KB)) - 20:21, 5 April 2019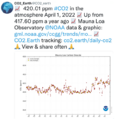
File:Mauna Loa CO2 - April 2022.png [[File:Mauna Loa-NOAA-Observatory.jpg]] '''Mauna Loa | Keeling Curve'''(600 × 618 (203 KB)) - 17:13, 5 April 2022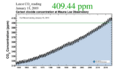
File:Mauna loa CO2 record scripps.png <big><big>'''CO2 Measurements @Mauna Loa, Hawaii'''</big></big> '''Highest Daily CO2 Records (by year) | Mauna Loa Observatory'''(800 × 480 (120 KB)) - 11:46, 22 May 2022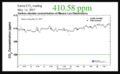
File:Mauna Loa CO2 week ending May 15, 2017.png '''Mauna Loa | Keeling Curve'''(800 × 493 (77 KB)) - 13:54, 2 April 2022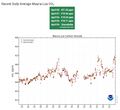
File:Mauna Loa Observatory CO2 - April 2021 - New record high.jpg <big>'''Mauna Loa Observatory CO2 - April 2021 - New record high'''</big> ...xide, or CO2, was measured at more than 420 parts per million at the Mauna Loa Observatory on the Big Island of Hawaii."''(656 × 600 (55 KB)) - 14:33, 9 April 2021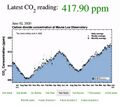
File:CO2 at Mauna Loa data - June 02, 2020 - 417.90 ppm.jpg ...er than the peak of 414.8ppm in 2019, according to readings from the Mauna Loa observatory in the US. ...ear to year. Measurements have been taken continuously at the remote Mauna Loa observatory in Hawaii since 1958, providing vital information for climate s(640 × 566 (66 KB)) - 16:33, 4 June 2020


Page text matches
File:Mauna Loa CO2 - April 2022.png [[File:Mauna Loa-NOAA-Observatory.jpg]] '''Mauna Loa | Keeling Curve'''(600 × 618 (203 KB)) - 17:13, 5 April 2022File:Mauna Loa - CO2 - Feb2019.jpg ''Highest weekly average CO2 ever measured at Mauna Loa: 412.4 ppm, almost 4 ppm above same time last year.'' ''2018's max monthly Mauna Loa CO2 concentration was 411.3 ppm in May. The [https://en.wikipedia.org/wiki/(642 × 600 (57 KB)) - 20:21, 5 April 2019File:Mauna loa CO2 record scripps.png <big><big>'''CO2 Measurements @Mauna Loa, Hawaii'''</big></big> '''Highest Daily CO2 Records (by year) | Mauna Loa Observatory'''(800 × 480 (120 KB)) - 11:46, 22 May 2022
File:C02 in atmosphere chart-3.png ::<big>On Mauna Loa in Hawaii, decades of mountaintop CO2 measurements chart an ominous climate ''Scripps Institute CO2 measurements at Mauna Loa have been supported for many years by the U.S. Department of Energy (DOE),(570 × 800 (133 KB)) - 17:01, 25 September 2023File:Mauna Loa-NOAA-Observatory.jpg : About the Mauna Loa Observatory ''Scripps CO2 measurements at Mauna Loa have been supported for many years by the U.S. Department of Energy (DOE),(800 × 450 (77 KB)) - 16:26, 28 November 2022File:Mauna Loa Observatory CO2 - April 2021 - New record high.jpg <big>'''Mauna Loa Observatory CO2 - April 2021 - New record high'''</big> ...xide, or CO2, was measured at more than 420 parts per million at the Mauna Loa Observatory on the Big Island of Hawaii."''(656 × 600 (55 KB)) - 14:33, 9 April 2021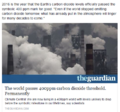
File:October 2016-400PPM.png ...a.gov/gmd/ccgg/trends/monthly.html '''''Latest CO2 Data Reports from Mauna Loa'''''] [[File:Mauna Loa CO2 week ending May 15, 2017.png]](494 × 463 (160 KB)) - 17:27, 21 May 2017File:CO2 at Mauna Loa data - June 02, 2020 - 417.90 ppm.jpg ...er than the peak of 414.8ppm in 2019, according to readings from the Mauna Loa observatory in the US. ...ear to year. Measurements have been taken continuously at the remote Mauna Loa observatory in Hawaii since 1958, providing vital information for climate s(640 × 566 (66 KB)) - 16:33, 4 June 2020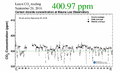
File:Red Line PPM.png [[File:Mauna Loa CO2 week ending May 15, 2017.png]](800 × 486 (163 KB)) - 17:33, 21 May 2017
File:Carbon Clock March 23, 2017.png [[File:Mauna Loa CO2 week ending May 15, 2017.png]](800 × 194 (44 KB)) - 12:43, 26 October 2021File:Mauna Loa CO2 week ending May 15, 2017.png '''Mauna Loa | Keeling Curve'''(800 × 493 (77 KB)) - 13:54, 2 April 2022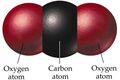
File:CO2 photo.JPG <big>'''Oh NOAA, Oh Mauna Loa, Looking and Measuring Up and Out'''</big> [[File:Mauna Loa-NOAA-Observatory.jpg]](800 × 536 (88 KB)) - 18:25, 2 January 2024File:Mauna Loa - CO2 - Apr2019.jpg Mauna Loa, Hawaii / Global / CO2 Movie / CO2 Emissions '''Highest Daily CO2 Records (by year) | Mauna Loa Observatory'''(642 × 600 (78 KB)) - 13:27, 6 April 2019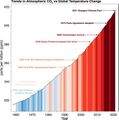
File:Global climate conferences and GHG increases.jpg ...itiation of a number of new geophysical observations (especially the Mauna Loa measurements of atmospheric carbon dioxide) during the 1957 International G(793 × 801 (56 KB)) - 21:25, 11 November 2022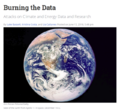
File:Burning the Data.png ...h System Research Laboratory, Global Monitoring Division: Welcome to Mauna Loa Observatory!”, available at https://www.esrl.noaa.gov/gmd/obop/mlo/'' ↩(640 × 597 (434 KB)) - 21:19, 18 February 2024


