File:Renewables v fossil fuels life cycle CO2 impact-chart.png: Difference between revisions
Jump to navigation
Jump to search
Siterunner (talk | contribs) No edit summary |
Siterunner (talk | contribs) No edit summary |
||
| Line 2: | Line 2: | ||
[https://www.nature.com/articles/s41560-017-0032-9.epdf?sharing_token=qENH1auKhRrqIL4gENXYGNRgN0jAjWel9jnR3ZoTv0PrhuJrzSPO9ccGqFarI4uqr80HaQ7J1c49McVGZ5lipWq0rdgWpnYzZ_NJiS8ILxBLuG2yh_t1VaQMonwI80rO3GR9VuDVn4qD5deuehDw0KN6dpBUsoD8AGcvRw0DwBm1F-nVM-nUvZThKZ4dtjMePqqbXYPiCj4G5LVdJTGRjqgo7CDqpFyIsV_wb7DqRLHxn4WodDb6l42FJQauSOp546EAIdFEorltF_JVTMWvJqUzcAMoN4aKpY76F9jADYK_G0O0dNMS3lUQO7umXoz7ndjndQVKLZoDTC7c6Wgt5cMJW358B3XihIpigAE_i7M%3D&tracking_referrer=amp.theguardian.com Understanding future emissions from low-carbon power systems by integration of life-cycle assessment and integrated energy modelling] | [https://www.nature.com/articles/s41560-017-0032-9.epdf?sharing_token=qENH1auKhRrqIL4gENXYGNRgN0jAjWel9jnR3ZoTv0PrhuJrzSPO9ccGqFarI4uqr80HaQ7J1c49McVGZ5lipWq0rdgWpnYzZ_NJiS8ILxBLuG2yh_t1VaQMonwI80rO3GR9VuDVn4qD5deuehDw0KN6dpBUsoD8AGcvRw0DwBm1F-nVM-nUvZThKZ4dtjMePqqbXYPiCj4G5LVdJTGRjqgo7CDqpFyIsV_wb7DqRLHxn4WodDb6l42FJQauSOp546EAIdFEorltF_JVTMWvJqUzcAMoN4aKpY76F9jADYK_G0O0dNMS3lUQO7umXoz7ndjndQVKLZoDTC7c6Wgt5cMJW358B3XihIpigAE_i7M%3D&tracking_referrer=amp.theguardian.com '''''Understanding future emissions from low-carbon power systems by integration of life-cycle assessment and integrated energy modelling'''''] | ||
~ | |||
[[Category:Atmospheric Science]] | |||
[[Category:Climate Change]] | |||
[[Category:Green Graphics]] | [[Category:Green Graphics]] | ||
[[Category:Fossil Fuels]] | [[Category:Fossil Fuels]] | ||
[[Category:Renewable Energy]] | [[Category:Renewable Energy]] | ||
Latest revision as of 16:04, 7 May 2020
File history
Click on a date/time to view the file as it appeared at that time.
| Date/Time | Thumbnail | Dimensions | User | Comment | |
|---|---|---|---|---|---|
| current | 15:23, 6 May 2020 | 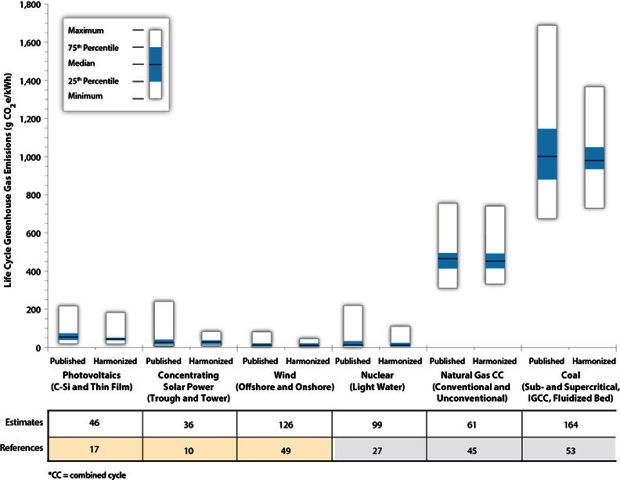 | 620 × 480 (85 KB) | Siterunner (talk | contribs) |
You cannot overwrite this file.
File usage
The following 2 pages use this file: