File:NASA-aerosol-earth.png
NASA-aerosol-earth.png (800 × 411 pixels, file size: 443 KB, MIME type: image/png)
<addthis />
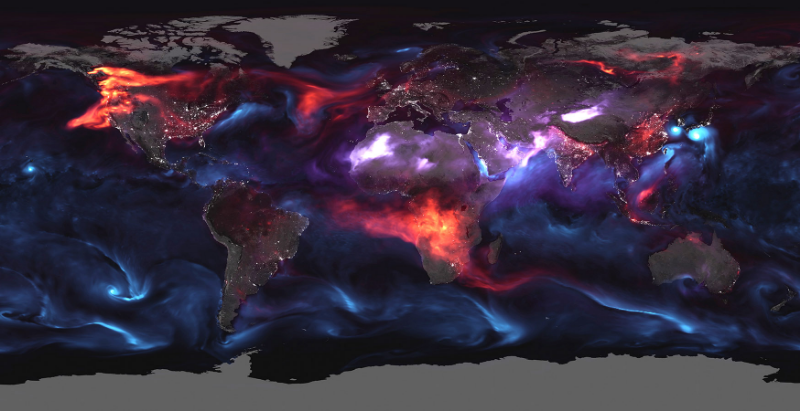
Atmospheric Particulates
- August 23, 2018
Heatwaves, hurricanes and other extreme weather events might be the "face of climate change," but they are not the only signs.
A grim new visualization from NASA shows another problem caused indirectly by global warming: airborne particles and droplets. These "aerosols," shown on a single day on August 23rd, come from dust, volcanic ash and other sources. They're particularly brutal this year because of fires in California, British Columbia and the southern part of Africa...
○
Welcome the First International Environmental Treaty'

The 1987 Montreal Protocol is commonly cited as a success story at international level. The aim of the agreement was to limit the release of Chlorofluorocarbon (CFC) aerosols into the atmosphere and subsequently halt the depletion of Ozone (O3) in the stratosphere.
There were a number of factors that contributed to Montreal’s success, these included:
- The problem and solution were both clearly defined and supported by industry (albeit not initially);
- The Ozone hole was easily measurable;
- There was an effective scientific lobbying alliance that played a key role in convincing the US Government and the commercial sector (in particular DuPont, then one of the largest manufacturers of CFCs).
The aim of the Montreal Protocol has been to eliminate the source of CFC emissions, as a result the only really feasible way for a state to achieve this would be through a ban on substances related to Ozone depletion.
How bad would the ozone hole be if we did nothing?
Monitoring and measuring over the years since the passage of the Montreal Protocol demonstrates the successful implementation, and model, of international cooperation.

File history
Click on a date/time to view the file as it appeared at that time.
| Date/Time | Thumbnail | Dimensions | User | Comment | |
|---|---|---|---|---|---|
| current | 15:13, 28 August 2018 | | 800 × 411 (443 KB) | Siterunner (talk | contribs) |
You cannot overwrite this file.
File usage
The following page uses this file: