File:Who emits the most CO2.png

Original file (800 × 732 pixels, file size: 334 KB, MIME type: image/png)
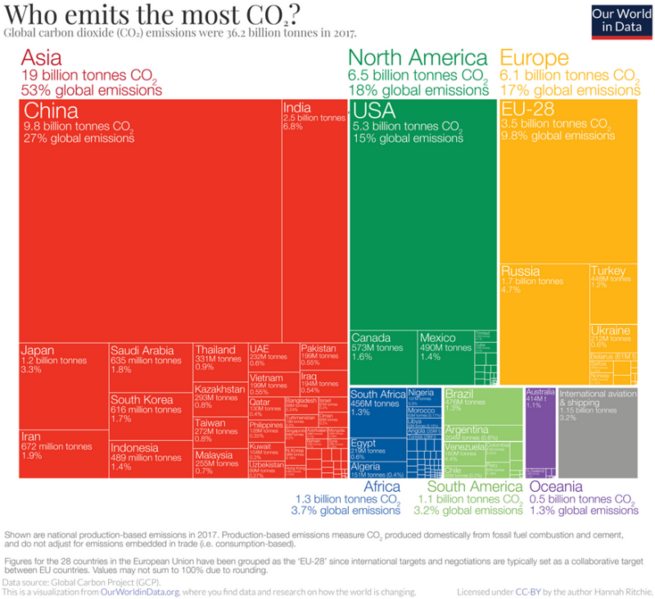
Who emits the most CO2 today?
Which countries emit the most CO2 today? How do annual emissions vary across the world?
(small>Last updated on April 30, 2020
Who emits the most CO2 each year? In the treemap visualization we show annual CO2 emissions by country, and aggregated by region. Treemaps are used to compare entities (such as countries or regions) in relation to others, and relative to the total. Here each inner rectangle represents a country – which are then nested and colored by region. The size of each rectangle corresponds to its annual CO2 emissions in 2017. Combined, all rectangles represent the global total
The emissions shown here relate to the country where CO2 is produced (i.e.production-based CO2) , not to where the goods and services that generate emissions are finally consumed. We look at the difference in each country’s production vs. consumption (trade-adjusted) emissions here
File history
Click on a date/time to view the file as it appeared at that time.
| Date/Time | Thumbnail | Dimensions | User | Comment | |
|---|---|---|---|---|---|
| current | 17:45, 28 December 2021 | | 800 × 732 (334 KB) | Siterunner (talk | contribs) |
You cannot overwrite this file.
File usage
The following 3 pages use this file: