File:Renewable Energy investment growth chart 2004-2014.jpg: Difference between revisions
Jump to navigation
Jump to search
Siterunner (talk | contribs) No edit summary |
Siterunner (talk | contribs) No edit summary |
||
| Line 1: | Line 1: | ||
http://www.carbonbrief.org/seven-charts-show-how-renewable-investment-broke-records-in-2015 | http://www.carbonbrief.org/seven-charts-show-how-renewable-investment-broke-records-in-2015 | ||
[[File:Renewable Potential US-Utility Scale PV.png]] | |||
Revision as of 12:34, 31 March 2016

File history
Click on a date/time to view the file as it appeared at that time.
| Date/Time | Thumbnail | Dimensions | User | Comment | |
|---|---|---|---|---|---|
| current | 16:02, 11 July 2018 | 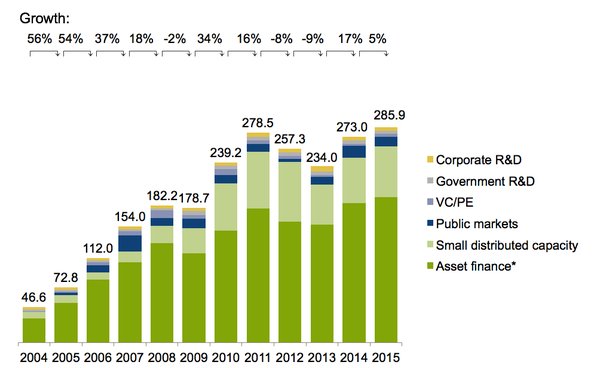 | 600 × 368 (31 KB) | Siterunner (talk | contribs) | |
| 03:45, 31 March 2016 |  | 600 × 368 (31 KB) | Siterunner (talk | contribs) | http://www.carbonbrief.org/seven-charts-show-how-renewable-investment-broke-records-in-2015 |
You cannot overwrite this file.
File usage
The following 3 pages use this file: