File:Renewable Potential US-Utility Scale PV.png: Difference between revisions
Jump to navigation
Jump to search
Siterunner (talk | contribs) No edit summary |
Siterunner (talk | contribs) No edit summary |
||
| Line 1: | Line 1: | ||
Via Environment America Research & Policy Center | |||
Note: Current (2016) U.S. electricity usage, circle, at the bottom right. Everything else is the US renewable potential. | |||
Earlier this year, the National Renewable Energy Laboratory released a report that said the United States’ upper ceiling on rooftop solar generation potential was around 39 percent of all U.S. electricity sales. That’s the tiny yellow circle in the middle. The potential of '''utility-scale solar?''' 350 times that... | |||
Revision as of 12:32, 31 March 2016
Via Environment America Research & Policy Center
Note: Current (2016) U.S. electricity usage, circle, at the bottom right. Everything else is the US renewable potential.
Earlier this year, the National Renewable Energy Laboratory released a report that said the United States’ upper ceiling on rooftop solar generation potential was around 39 percent of all U.S. electricity sales. That’s the tiny yellow circle in the middle. The potential of utility-scale solar? 350 times that...
File history
Click on a date/time to view the file as it appeared at that time.
| Date/Time | Thumbnail | Dimensions | User | Comment | |
|---|---|---|---|---|---|
| current | 12:31, 31 March 2016 | 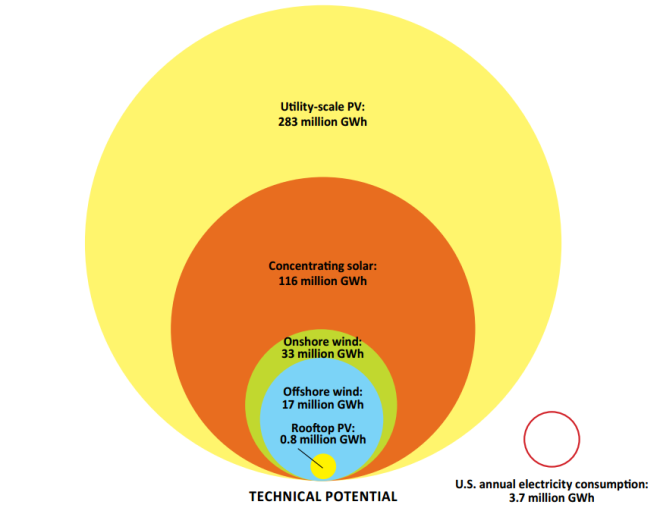 | 660 × 514 (57 KB) | Siterunner (talk | contribs) |
You cannot overwrite this file.
File usage
The following 2 pages use this file: