File:Worlds energy sources chart - circa 2019.jpg: Difference between revisions
Jump to navigation
Jump to search
Siterunner (talk | contribs) No edit summary |
Siterunner (talk | contribs) No edit summary |
||
| Line 32: | Line 32: | ||
<big>Countries - Energy Mix | <big>Countries - Energy Mix</big> | ||
* https://docs.google.com/spreadsheets/d/18uZplfA0ytgfI69QeELWd0PDKh2zr3dRHI3P9FE_3Qs/edit#gid=1294587660 | * https://docs.google.com/spreadsheets/d/18uZplfA0ytgfI69QeELWd0PDKh2zr3dRHI3P9FE_3Qs/edit#gid=1294587660 | ||
Latest revision as of 15:43, 27 February 2021
Energy - World Daily MWh
Via Our World in Data / www.ourworldindata.com
Global Power Plant Database, EIA, IAEA, Power Technology & Media Reports Data (2019)
World Energy Sources Chart
Daily MWh Scale
Potential Energy Capacity
Wind - Solar - Hydro - Geothermal - Tidal
MWh calculator
Countries - Energy Mix
World Electricity Mix
~
File history
Click on a date/time to view the file as it appeared at that time.
| Date/Time | Thumbnail | Dimensions | User | Comment | |
|---|---|---|---|---|---|
| current | 15:40, 27 February 2021 | 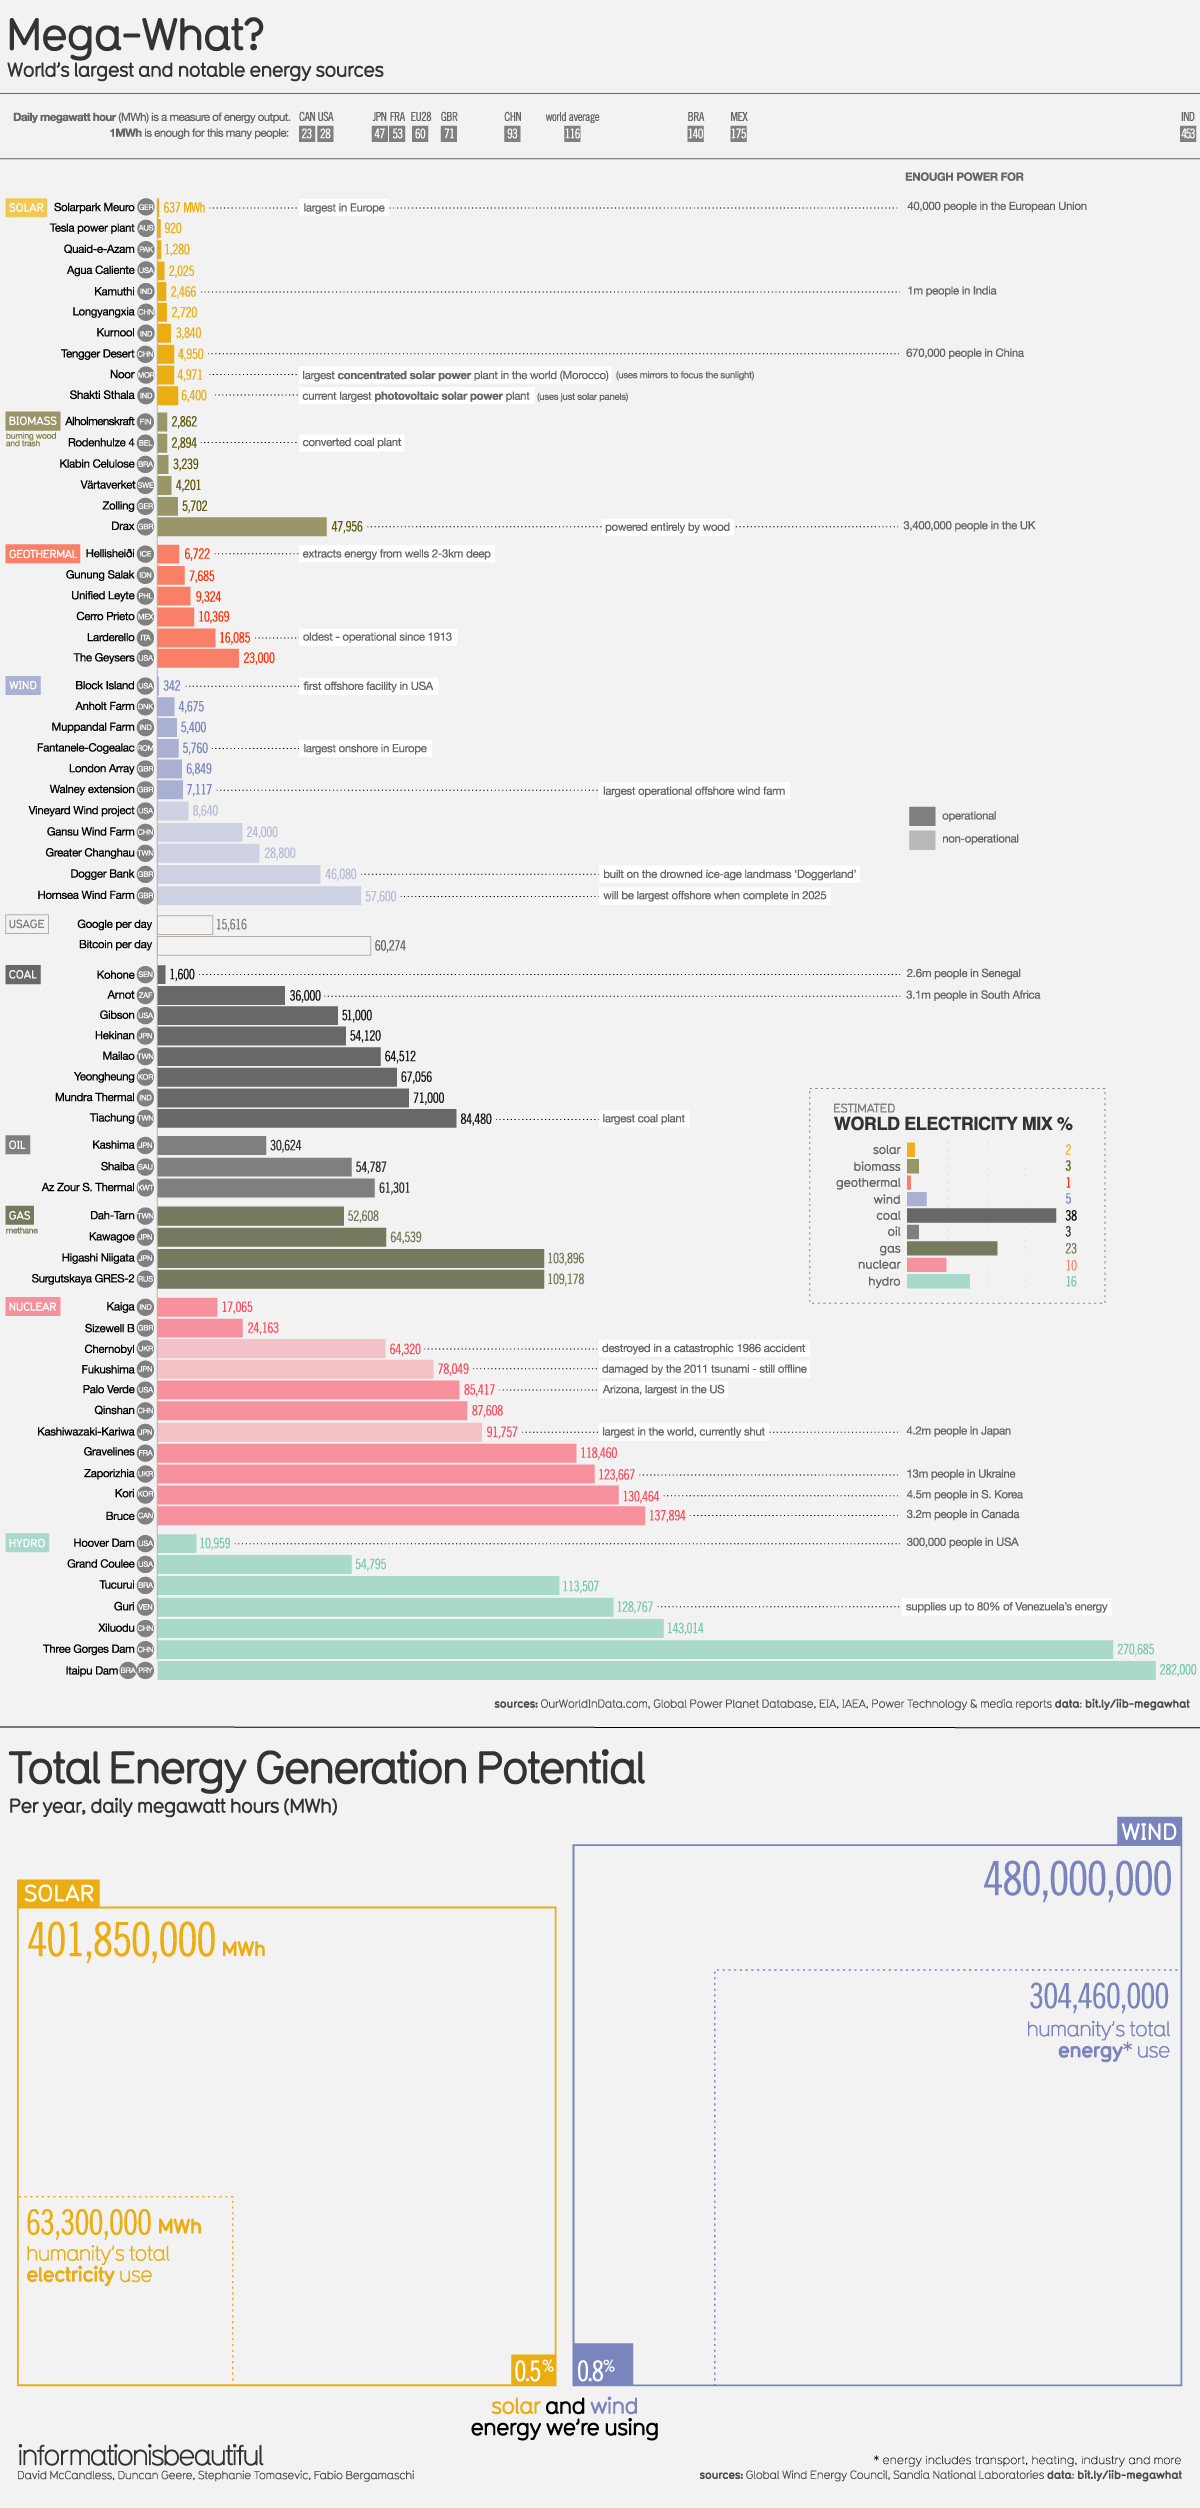 | 1,200 × 2,508 (633 KB) | Siterunner (talk | contribs) |
You cannot overwrite this file.
File usage
The following page uses this file: