File:RCP-projections-damage to US economy.jpg: Difference between revisions
Siterunner (talk | contribs) No edit summary |
Siterunner (talk | contribs) No edit summary |
||
| Line 1: | Line 1: | ||
<big>'''''Representative Concentration Pathway'''''</big> | |||
* https://en.m.wikipedia.org/wiki/Representative_Concentration_Pathway | |||
''''' | [https://nca2018.globalchange.gov/'''2018 / U.S. National Climate Assessment'''] / [https://carbon2018.globalchange.gov/ '''U.S. Carbon Assessment'''] | ||
Projections of possible 'economic impact' on the US economy are represented in graphic format, as with the attached slide. | Projections of possible 'economic impact' on the US economy are represented in graphic format, as with the attached slide. | ||
Robert Rohde's | Robert Rohde's points out in a Tweet thread (here https://mobile.twitter.com/RARohde/status/1067375439415582721) that recent climate assessment projections were reported by the US media without specifying the range of possible outcomes in sufficient detail. | ||
As Robert | As Robert makes his case in his series of Tweets: | ||
''In the reporting on the National Climate Assessment, some articles (such as this by [https://edition.cnn.com/2018/11/23/health/climate-change-report-bn/index.html @CNN]) have focused on the far end of the risk distribution and say that "the economy could lose ... more than 10% of its GDP" by 2100.'' | ''In the reporting on the National Climate Assessment, some articles (such as this by [https://edition.cnn.com/2018/11/23/health/climate-change-report-bn/index.html @CNN]) have focused on the far end of the risk distribution and say that "the economy could lose ... more than 10% of its GDP" by 2100.'' | ||
| Line 48: | Line 47: | ||
○ | ○ | ||
<big><u>'''''[[Climate News]]'''''</u></big> | |||
[https://www.bloomberg.com/amp/news/articles/2018-11-23/americans-will-pay-billions-more-for-climate-change-and-that-s-the-best-case '''U.S National Climate Assessment: A Bleak Report, a Bleak Government Response'''] | |||
[https://earther.gizmodo.com/government-climate-report-lays-out-how-screwed-we-are-i-1830624858/amp '''The New Abnormal'''] / [https://www.eenews.net/stories/1060107237 '''E&E News: Not Good, Bad, Very Bad, Soon to be Worse'''] | |||
○ | |||
Revision as of 19:28, 29 November 2018
Representative Concentration Pathway
2018 / U.S. National Climate Assessment / U.S. Carbon Assessment
Projections of possible 'economic impact' on the US economy are represented in graphic format, as with the attached slide.
Robert Rohde's points out in a Tweet thread (here https://mobile.twitter.com/RARohde/status/1067375439415582721) that recent climate assessment projections were reported by the US media without specifying the range of possible outcomes in sufficient detail.
As Robert makes his case in his series of Tweets:
In the reporting on the National Climate Assessment, some articles (such as this by @CNN) have focused on the far end of the risk distribution and say that "the economy could lose ... more than 10% of its GDP" by 2100.
I'd like to push back a little.
In Chapter 2, (link: https://nca2018.globalchange.gov/chapter/2/), a 90% likelihood range of ~4.5 to ~9.8 F is indicated for RCP8.5, with a most likely value of about 7 F.
(review the history of RCP science and statistics)
He then refers to Ch. 29 of the report and the following:
...the high estimate comes from RCP8.5 (red dots), an emissions scenario which assumes extremely aggressive growth of CO2 emissions.
While possible, I certainly wouldn't regard RCP8.5 as a likely future.
More importantly, a close examination of the GDP figure will notice that there are many red dots associated with RCP8.5. The distribution of red dots reflects an uncertainty in the climate's response to this much CO2, and covers a very large range from 4 F to 14 F at 2100.
This presented range is huge. In fact, it is substantially larger than the response range presented elsewhere in the same report. In Chapter 2, (link: https://nca2018.globalchange.gov/chapter/2/) nca2018.globalchange.gov/chapter/2/, a 90% likelihood range of ~4.5 to ~9.8 F is indicated for RCP8.5, with a most likely value of about 7 F.
One can and should make the case, as Robert does here, that current projections of climate change impacts are of course seen as *a range* of possibilities and proabilities. What Robert neglects to include in his remarks is the dynamic forces at work and the human factor including the climate report and science being dismissed by a large swath of political voices, generally from conservative business interests and tradition religious points of view.
The science over time demonstrates, with a powerful case and degree of certainty, the reality of climate change/global warming. The evidence is convincing in its facts and details.
What is up for debate now is how fast the impacts will be felt on human communities, and earth systems that impact life, economics and ecology.
A "precautionary principle" and [protection of https://www.greenpolicy360.net/w/The_Commons "The Commons"] must be kept in mind.
The future well-being of each and every one of us, and the health of life on planet Earth call for new vision, wisdom and action.
○
U.S National Climate Assessment: A Bleak Report, a Bleak Government Response
The New Abnormal / E&E News: Not Good, Bad, Very Bad, Soon to be Worse
○
File history
Click on a date/time to view the file as it appeared at that time.
| Date/Time | Thumbnail | Dimensions | User | Comment | |
|---|---|---|---|---|---|
| current | 18:52, 29 November 2018 | 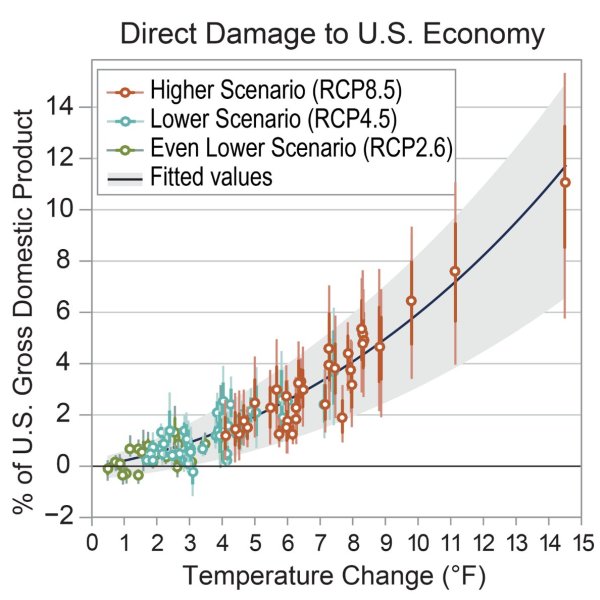 | 600 × 600 (62 KB) | Siterunner (talk | contribs) |
You cannot overwrite this file.