File:Mauna Loa-NOAA-Observatory.jpg: Difference between revisions
Siterunner (talk | contribs) No edit summary |
Siterunner (talk | contribs) No edit summary |
||
| Line 3: | Line 3: | ||
:<big><big><big><big>'''Tracking the CO2, Tracking the Atmospheric Change'''</big></big></big></big> | :<big><big><big><big>'''Tracking the CO2, Tracking the Atmospheric Change'''</big></big></big></big> | ||
::<big><big><big>'''The Keeling Curve'''</big></big></big> | |||
::[[File:C02 in atmosphere chart-3.png]] | |||
[https://www.history.com/news/keeling-curve-global-warming-climate-change <big><big>'''The Keeling Curve: Watch It!'''</big></big>] | |||
:<big>'''Keeling's Curve has been called one of the most important scientific works of the 20th century'''</big> | |||
''Scripps CO2 measurements at Mauna Loa have been supported for many years by the U.S. Department of Energy (DOE), and have more recently been supplemented by Earth Networks, a technology company collaborating with Scripps to expand the global GHG monitoring network. Support for website development was provided in part by the National Science Foundation (NSF).'' | |||
:<big>2022</big> | :<big>2022</big> | ||
Revision as of 15:58, 28 November 2022
- Tracking the CO2, Tracking the Atmospheric Change
- The Keeling Curve

- Keeling's Curve has been called one of the most important scientific works of the 20th century
Scripps CO2 measurements at Mauna Loa have been supported for many years by the U.S. Department of Energy (DOE), and have more recently been supplemented by Earth Networks, a technology company collaborating with Scripps to expand the global GHG monitoring network. Support for website development was provided in part by the National Science Foundation (NSF).
- 2022

2021
Mauna Loa, Hawaii - NOAA

2020
CO2 Measurements @Mauna Loa, Hawaii
• https://www.esrl.noaa.gov/gmd/ccgg/trends/
• https://www.esrl.noaa.gov/gmd/ccgg/trends/full.html
• https://scripps.ucsd.edu/programs/keelingcurve/
Highest Daily CO2 Records (by year) | Mauna Loa Observatory
Measurements are made by two independent CO2 monitoring programs (NOAA and Scripps) at the Mauna Loa Observatory in Hawaii about 3400 metres above sea level.


2019 (as of January 12, 2019)
413.45 ppm on January 12, 2019 (NOAA-ESRL)
411.14 ppm on January 7, 2019 (Scripps)
411.08 ppm on January 6, 2019 (Scripps)
2018
412.60 ppm on May 14, 2018 (Scripps)
412.45 ppm on May 14, 2018 (NOAA-ESRL)
412.37 ppm on April 23, 2018 (NOAA-ESRL)
2017
412.63 ppm on April 26, 2017 (NOAA-ESRL)
411.27 ppm on May 15, 2017 (NOAA-ESRL)
2016
409.44 ppm on April 9, 2016 (Scripps)
409.39 ppm on April 8, 2016 (Scripps)
2015
404.84 ppm on April 13, 2015 (Scripps)
○
File history
Click on a date/time to view the file as it appeared at that time.
| Date/Time | Thumbnail | Dimensions | User | Comment | |
|---|---|---|---|---|---|
| current | 13:25, 6 April 2019 | 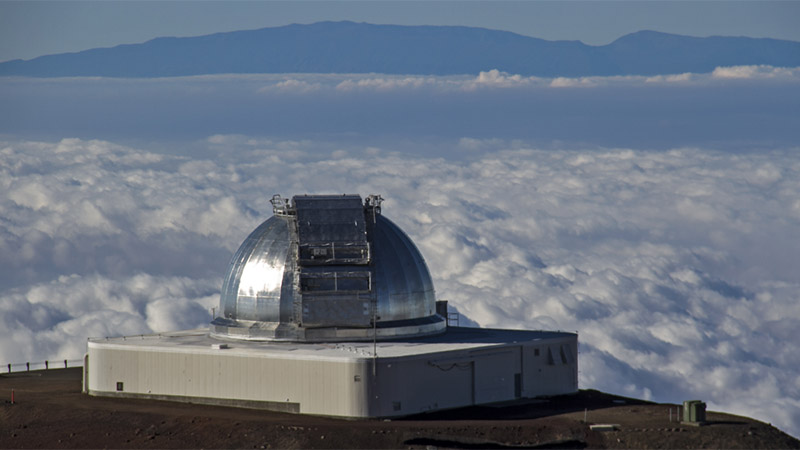 | 800 × 450 (77 KB) | Siterunner (talk | contribs) |
You cannot overwrite this file.
File usage
The following 9 pages use this file: